Recommended resources
The freely available resources this lesson will direct you to.
Hello! In our last lesson, you successfully orchestrated a multi-part animation sequence using animation-delay and CSS custom properties. You now have a title sequence where each element animates in the correct order.
However, creating a great animation is more than just getting the sequence right. It's about the nuance of the timing, the overlap between movements, and the overall rhythm—the details that make an animation feel polished and professional. Your designer's eye will tell you when something isn't quite right, but how do you fix it in code?
In this lesson, you will learn to debug and refine the timing and overlap of multiple animations to match your storyboard. We'll move from tweaking numbers in a CSS file to visually manipulating a timeline, a workflow that will feel much more intuitive for a motion designer. We'll be using a powerful, built-in feature of your web browser that many developers overlook: the Animations Panel.
By the end of this 60-minute lesson, you'll be able to visually diagnose timing issues and fine-tune your CSS animations with precision.
1. The Animator's Timeline in the Browser
Every modern browser comes with a suite of "Developer Tools" for inspecting how a webpage is built and how it behaves. Tucked away in these tools is the Animations Panel, a feature designed specifically for motion designers and developers to visualize and debug animations. It provides a waterfall timeline, very similar to what you'd find in professional animation software.
First, let's get you acquainted with the tool and how to open it.
Inspect and modify CSS animation effects | Chrome DevTools
The official Chrome documentation provides a clear, concise overview of the Animations panel. We'll use it to understand the tool's purpose and its main sections.
Read the 'Overview', 'Open the Animations panel', and 'Get familiar with the Animations panel UI' sections. This will introduce you to the tool's purpose and its four main parts: Controls, Overview, Timeline, and Details. Don't worry about memorizing everything; just get a feel for the layout.
Now that you have a conceptual overview, let's see it in action. A video is often the quickest way to understand the flow of using a new tool.
How to inspect animations #DevToolsTips
This short video from the Chrome for Developers team gives a fast and practical demonstration of opening the panel and inspecting an animation.
Watch from the beginning to 01:45. The video shows two ways to open the panel and demonstrates how it automatically records animations that play on the page. Notice how the recorded animation appears as a block on a timeline.
Go ahead and try this yourself. Open your title sequence project from the last lesson in your browser using the Live Server. Then, open the Animations panel as shown in the resources. If you don't see your animation, simply refresh the page, and the panel will capture it.
2. Deconstructing and Analyzing Your Sequence
With the Animations panel open and your title sequence captured, you should see a series of colored bars in a waterfall pattern. Each bar represents one of the animations you created (drawLine, fadeInTitle, etc.). This view instantly confirms that your animation-delay and --order properties from the last lesson are working.
Now, let's explore how to use this interface to analyze the motion.
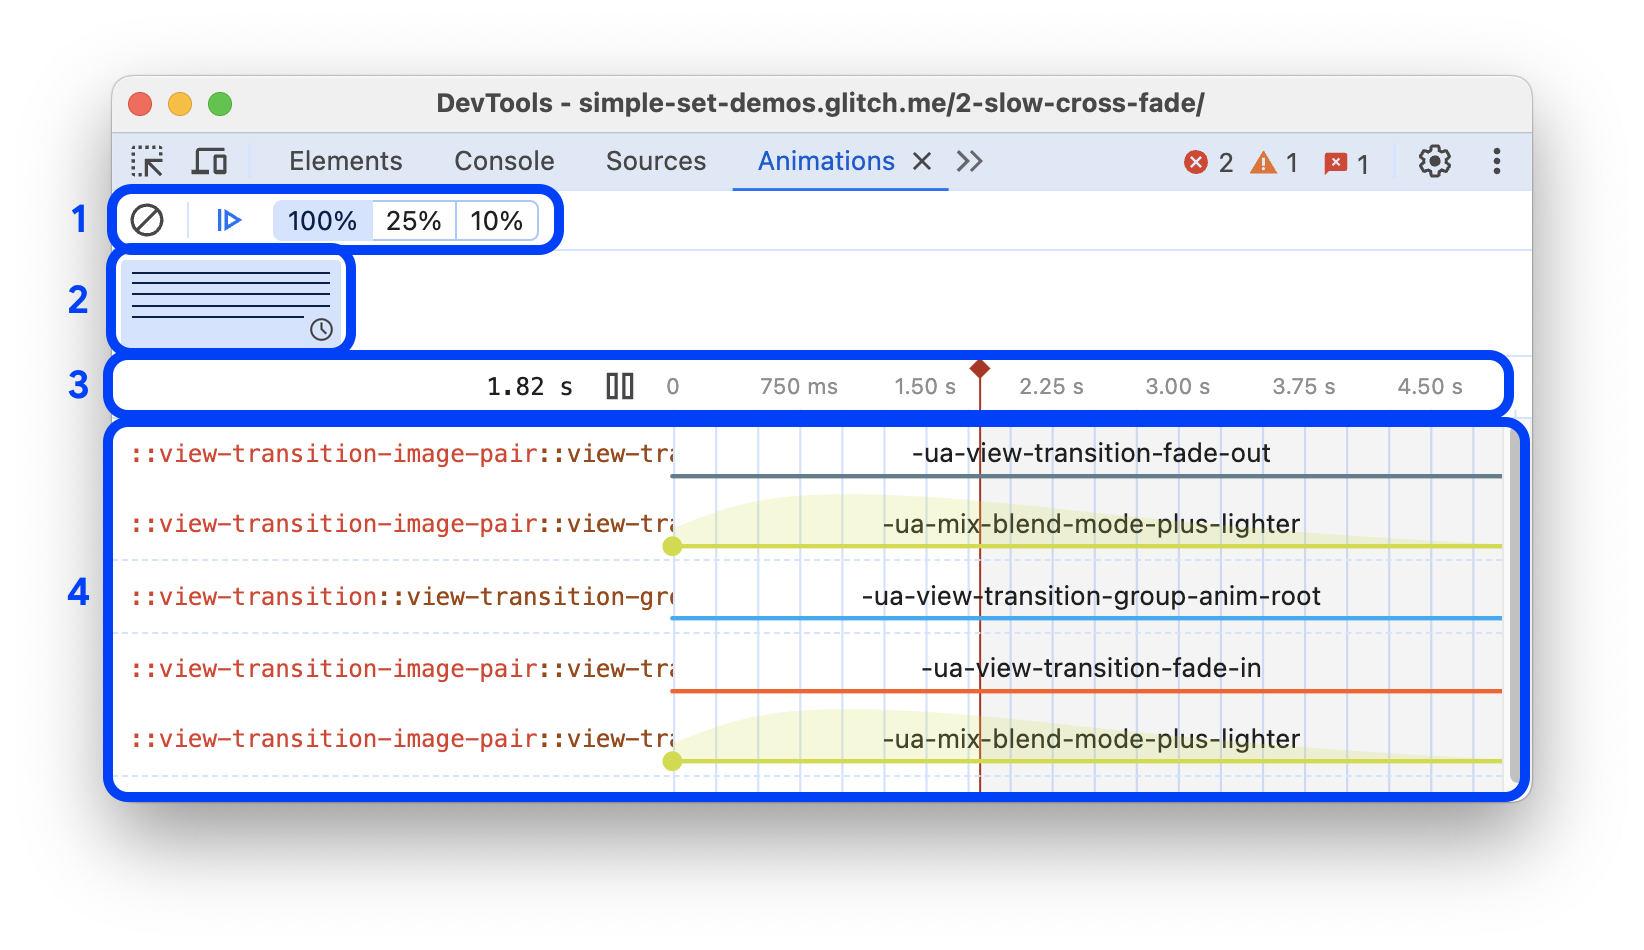
The three most fundamental debugging techniques are:
- Slowing it down: Just like an animator flipping through paper drawings slowly, you can reduce the playback speed to see the details of the motion. The speed controls (100%, 25%, 10%) are your best friend for spotting awkward interactions.
- Scrubbing: Instead of replaying the whole animation, you can drag the red vertical line (the playhead) back and forth along the timeline. This gives you precise control to examine the animation frame by frame.
- Pausing: Freezing the animation at a specific moment to inspect the state of all elements.
This video provides an excellent walkthrough of these core techniques.
I Will Never Write CSS Animations Again Without Using This Tool
The 'I Will Never Write CSS Animations Again' video by Web Dev Simplified gives a very clear demonstration of using the timeline to inspect and analyze animations.
Watch the segment from 01:52 to 04:25. Focus on how the presenter uses the replay button, adjusts the playback speed to 10% to analyze a fast transition, and scrubs the timeline to see the animation's state at any point.
3. Your Turn: Visually Refining the Timing
Analysis is useful, but the real power of the Animations panel is its ability to modify the animation in real-time. You can directly manipulate the animation blocks in the timeline to change their timing, and the browser will show you the result instantly.
There are two main modifications you can make:
- To adjust the
animation-delay: Click and drag the entire animation block left or right. - To adjust the
animation-duration: Drag the beginning or end of the block to shorten or lengthen it.
Let's use the official documentation again for a clear visual guide.
Inspect and modify CSS animation effects | Chrome DevTools
This section of the Chrome documentation has clear, animated GIFs showing exactly how to modify duration and delay by dragging elements in the timeline.
Focus on the section titled 'Modify animations'. Observe the three short GIF examples that show how to change the duration, a keyframe's timing, and the delay.
Practical Task
Now, it's your turn to be the choreographer. Let's refine your title sequence.
- Open your project and the Animations panel. Refresh the page to capture the animation.
- Goal: Let's say your storyboard requires the subtitle to start fading in just as the main title reaches full opacity, creating a subtle overlap.
- Action:
- Find the animation block for your subtitle in the timeline.
- Click and drag that block to the left. As you drag, watch the animation in the main browser window.
- Position it so its start aligns with the moment the title's fade-in is completing. You can slow down the playback to 10% to make this much easier.
- Observation:
- When you release the mouse, look at the Elements panel. DevTools has added an inline
styleattribute to your subtitle element, something likeanimation-delay: 650ms;. - This is a temporary change for quick iteration. Once you're happy with the new timing, you need to make it permanent. Instead of copying this exact value, go back to your CSS file and adjust the calculation in your
.animatedclass. For example, you might change* 400msto* 350msto tighten up the whole sequence.
- When you release the mouse, look at the Elements panel. DevTools has added an inline
This workflow—visual tweaking in the Animations panel followed by updating the source code—is incredibly efficient for finessing complex sequences.
4. Debugging a Common Animation Glitch
Sometimes when you try to replay an animation in the DevTools, it doesn't work. The element just sits there. This often happens with animations that only define an end state (e.g., a 100% keyframe) and rely on animation-fill-mode: forwards.
The problem is that after the animation runs once, the element is already in its final state. When you ask DevTools to replay it, it tries to animate from the final state to the final state, so nothing happens.
I Will Never Write CSS Animations Again Without Using This Tool
This is a common 'gotcha' that can be confusing. The same Web Dev Simplified video has an excellent section that explains this exact problem and shows a robust solution.
Watch from 07:24 to 09:49. Pay attention to the explanation of why the animation doesn't replay. The solution is to make your keyframes more explicit by adding a 0% or from block that defines the animation's starting state. This makes your animations more robust and easier to debug.
Another powerful debugging trick, especially for staggered animations, is to use a negative animation-delay.
Debugging CSS Keyframe Animations
The CSS-Tricks article 'Debugging CSS Keyframe Animations' offers a clever technique for inspecting an animation at a specific point in time without waiting for it to play.
Read the first section, 'Using Negative Delay Values'. The key idea is that you can pause an animation (animation-play-state: paused;) and then use a negative delay (e.g., animation-delay: -0.5s;) to instantly jump 0.5 seconds into the animation's timeline. This is a pro-level trick for debugging complex states.
Conclusion
Congratulations! You've now bridged the gap between a designer's eye and a developer's toolkit. You are no longer just telling the browser to animate; you're now able to visually direct how it animates with a level of precision that separates good motion from great motion.
Key Takeaways:
- The browser's Animations Panel is a visual timeline for inspecting, debugging, and refining CSS animations.
- You can analyze your sequences by slowing down playback speed, scrubbing the timeline, and pausing at critical moments.
- You can live-edit
animation-delayandanimation-durationby simply dragging and resizing animation blocks in the timeline. - Changes made in the panel are temporary inline styles, perfect for quick iteration. You should update your source code with the final, polished values.
In our next and final module, we'll focus on getting your masterpiece out of the browser and into the world. You'll learn how to record your CSS animation as a high-quality MP4 video file and get an introduction to the professional standard for web animation: the Lottie workflow.