Recommended resources
The freely available resources this lesson will direct you to.
- Create, Manage, and Save Chart Layouts: Full Demonstrationwww.youtube.com
- “Update NSE F&O List in Minutes | Build Custom Watchlists on TradingView 🔥”www.youtube.com
- Mastering the TradingView watchlists — TradingView Indiain.tradingview.com
- TradingView Symbol Search: tips for finding assets — TradingView Indiain.tradingview.com
Welcome back. Last time, you saw that a charted price move and the return on a leveraged position are different things. A workspace helps you observe the first without losing sight of the second: it should make the instrument, exchange, price, and time interval easy to identify—not encourage you to treat every movement as a trade.
This final lesson in the foundations module is hands-on. You will build a small Indian-equity watchlist in TradingView, set up one uncluttered chart, and check that both are saved. Allow about 40 minutes, including time to work in TradingView alongside the lesson.
Start with the right instrument, not just a familiar name
A company’s shares can appear under different symbols on different exchanges. Search results can also include an index, a future, or an option whose name resembles the stock you wanted. Before adding anything, check three pieces of information together: the ticker, the instrument description, and the exchange or data source.
TradingView’s Symbol Search: tips for finding assets explains why that check matters.
TradingView Symbol Search: tips for finding assets — TradingView India
Read TradingView India’s guide to distinguish a stock listing from other search results before building your list.
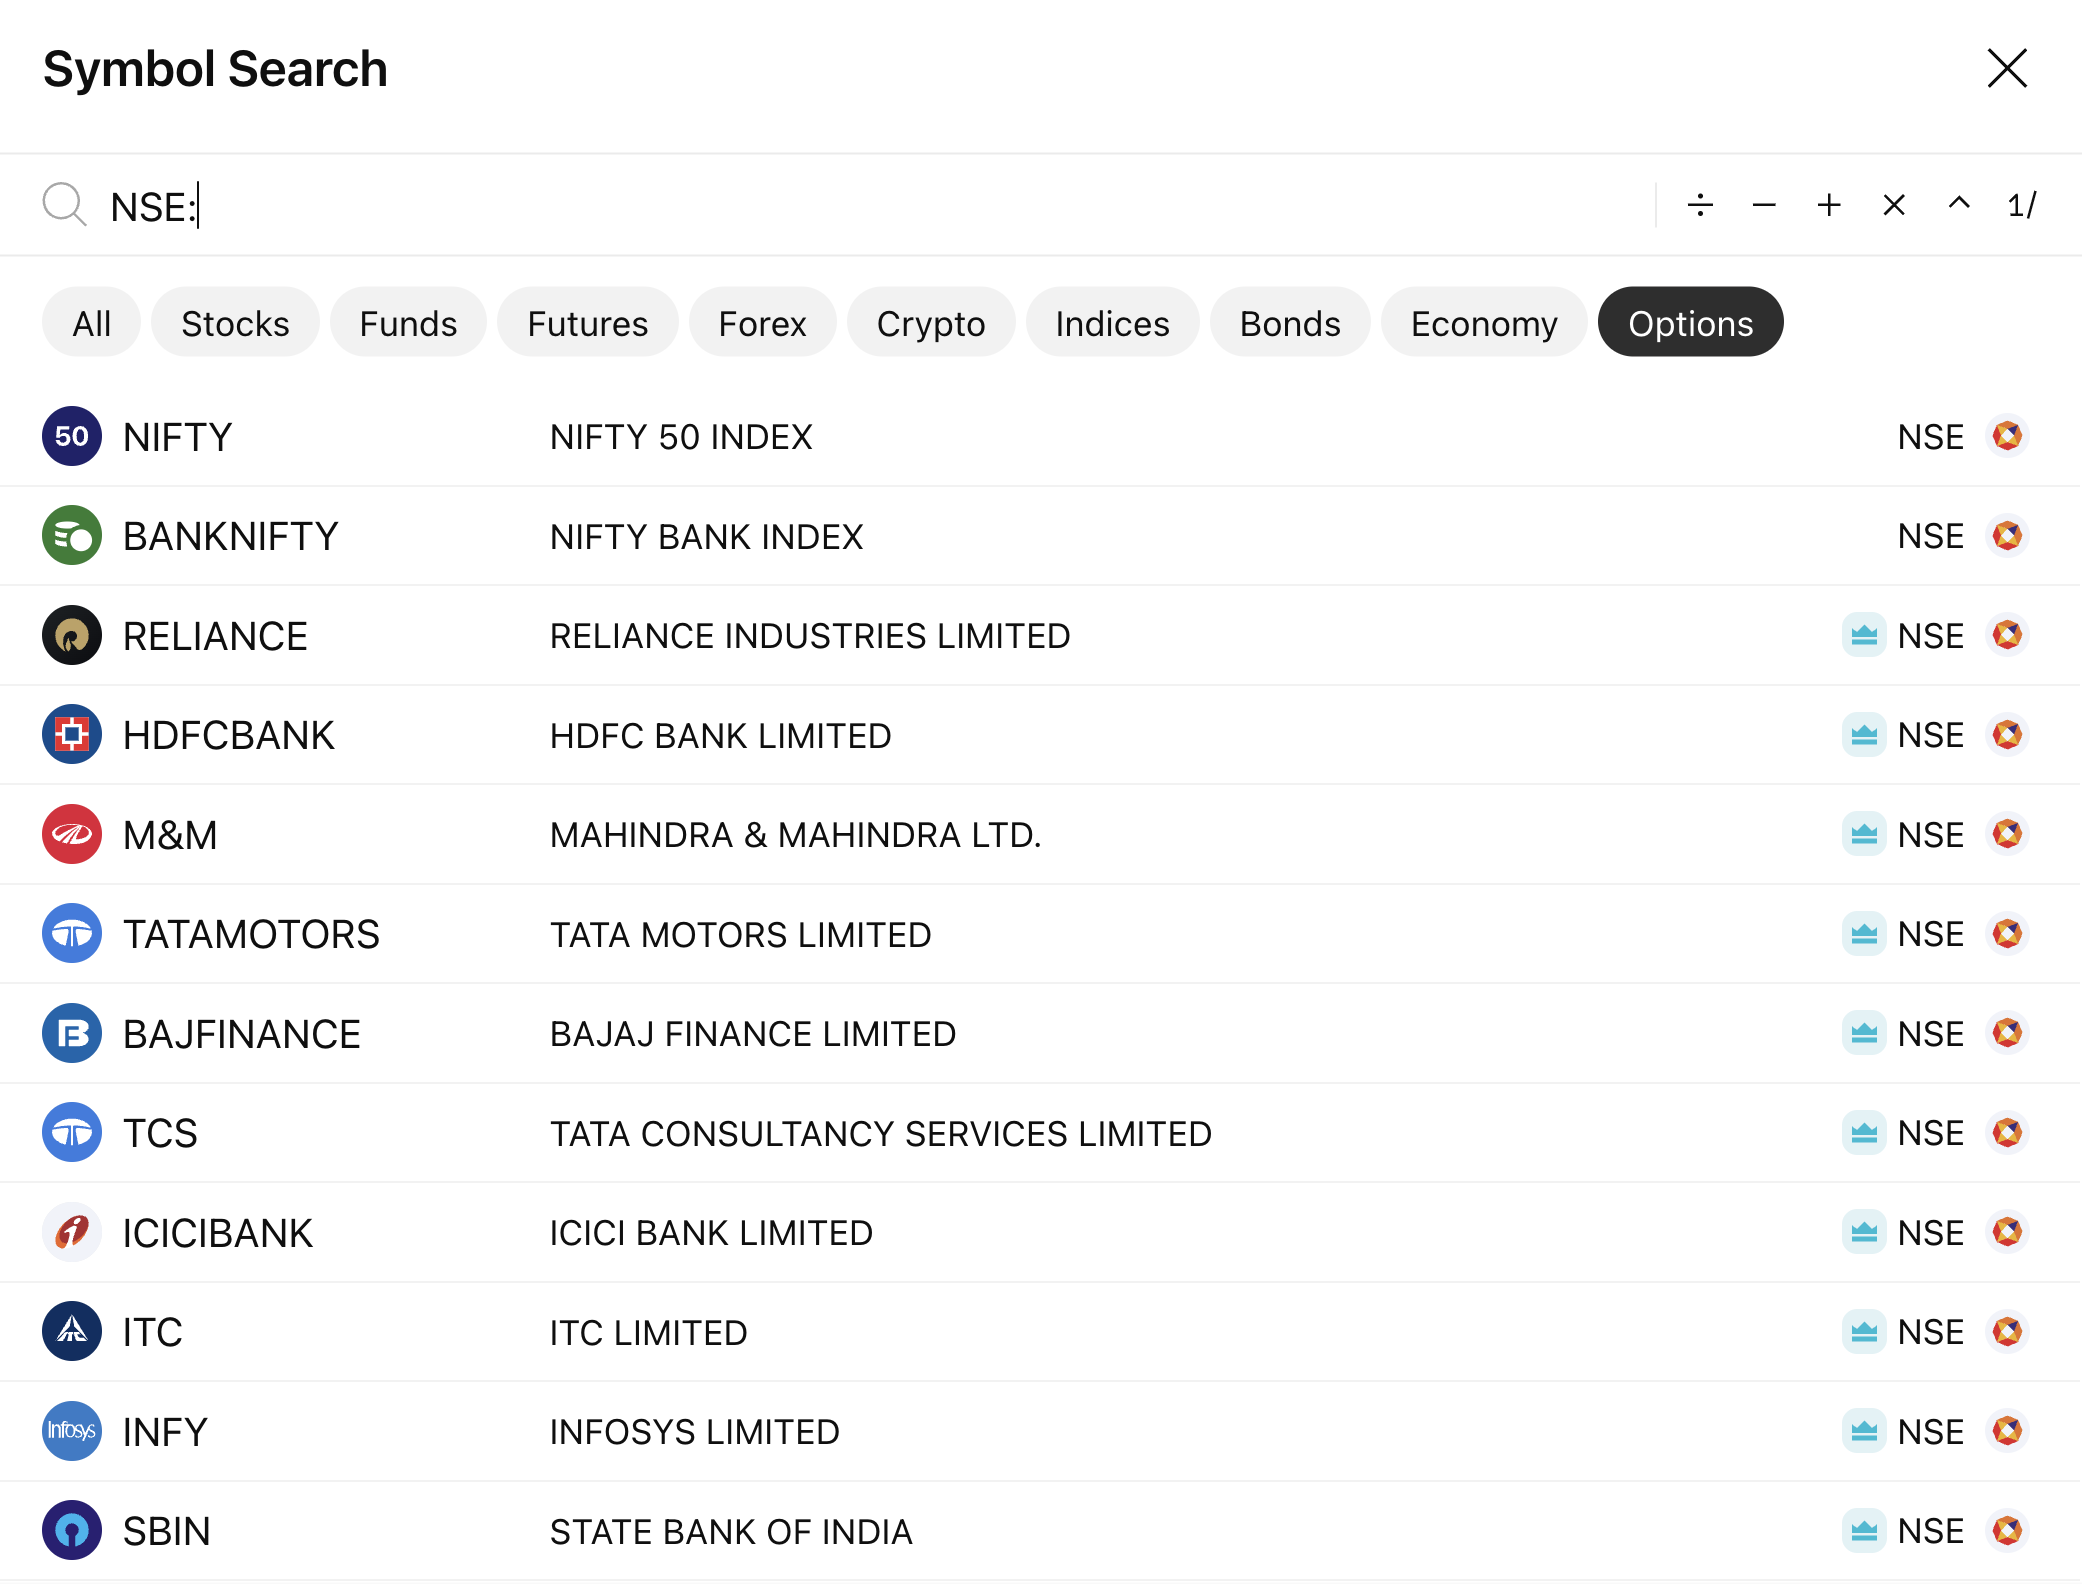
In “What are symbols,” read the ticker examples, particularly the NSE/BSE example. Then, in “How to access Symbol Search,” start at the paragraph explaining what appears in each result row and read the search guidance through the discussion of asset-type and exchange filters. Focus on how you would verify a result rather than selecting it by name alone.
For this workspace, choose cash-market stocks rather than options or futures. One manageable starting list is four examples: NSE:RELIANCE, NSE:HDFCBANK, NSE:INFY, and NSE:TCS. These are examples to locate on the platform, not recommendations to trade them. Verify each result’s current description and NSE listing before adding it. If a particular result is unavailable, use another clearly identified NSE-listed stock rather than a similarly named derivative.
The search image below shows where the result’s name, description, and exchange appear. Notice that Options is highlighted in this illustration; for your equity list, select Stocks instead.
Build a watchlist you can scan
A watchlist is a navigation tool: clicking a symbol lets you move among charts without repeatedly searching. Keeping it short makes errors easier to spot. A list mixing stocks, indices, and derivatives without clear labels would make a quick glance less reliable.
Study the setup controls in Mastering the TradingView watchlists, then use them to create your list.
Mastering the TradingView watchlists — TradingView India
Read TradingView India’s watchlist guide for the controls you will use to create, name, and simplify a list.
In “Setting up your watchlist,” begin where the guide says to open the right-hand watchlist panel. Read the setup steps through adding and organizing symbols. In “Watchlist metrics,” read the display options. Finally, in “Watchlist settings,” read the list-management options, concentrating on creating and renaming a list.
With TradingView open, sign in if you want the workspace saved to your account. Open the Watchlist panel on the right, create a new list if that option is available, and name it something descriptive such as Indian equities — practice. Use the + control to search for and add your verified NSE stocks. If your account or interface presents a different list limit or menu arrangement, a shorter saved list still meets the purpose.
For a clean first version, display the ticker and last price; add percentage change and volume if they remain readable at your screen width. You already know these quote fields from earlier lessons. They help you orient yourself, but a large percentage change alone is not evidence that a stock is suitable for a trade. Remove unrelated default symbols from this new practice list if needed; avoid clearing an existing list you want to keep.
Make one chart easy to read
Select a stock from the watchlist and open its chart. Your immediate aim is modest: when you glance at it, you should be able to answer which stock and exchange you are viewing, what one candle represents, where price is on the scale, and whether volume is visible.
Choose a single-chart view, standard candlesticks, and a time interval you can recognize at a glance—for example, 5 minutes for an intraday observation workspace. Keep volume visible below price. You do not need a collection of indicators or drawings for this lesson; leave room to see the candles and their price scale. An interval is a way of grouping data, not a trading signal. Check the chart’s displayed time zone before relating candle times to Indian exchange sessions; set or confirm Asia/Kolkata (IST) where your interface permits it.
Chart appearance is adjustable. The image shows TradingView’s Canvas settings, including background, grid lines, and scale text. It uses a vivid gradient as a demonstration; for your workspace, a plain, high-contrast background and subdued grid usually make price and labels easier to distinguish.
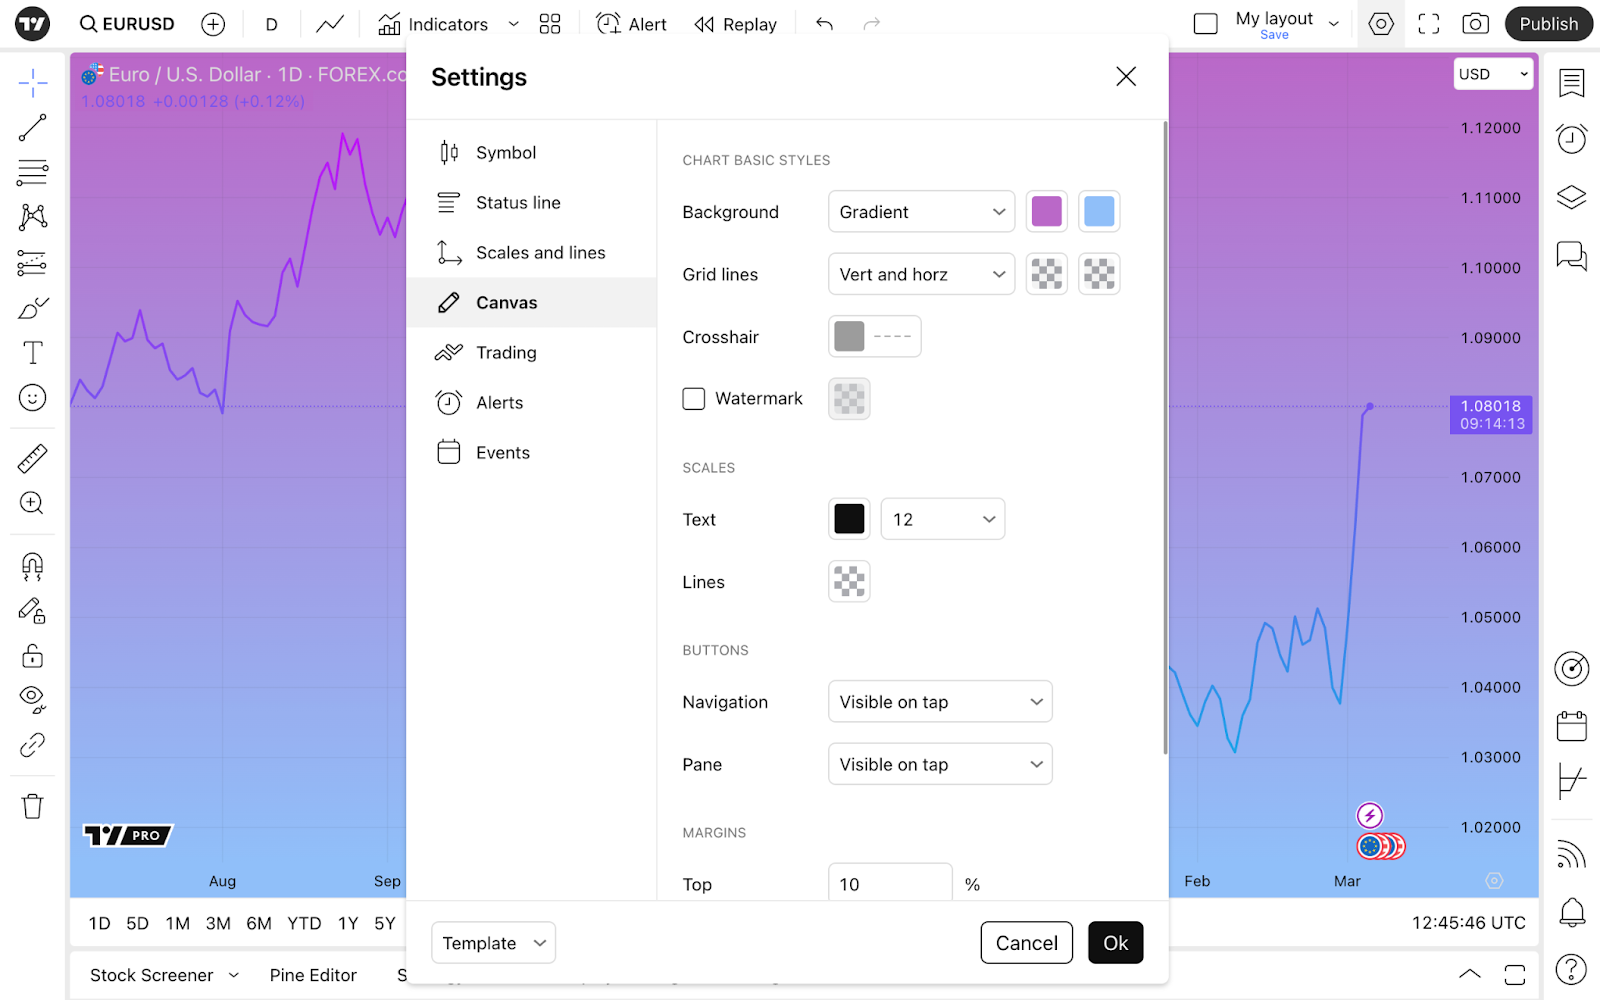
The layout should reduce ambiguity, not make a chart look impressive. After changing the appearance, check that candle bodies and wicks remain distinct, the price labels are legible, and the volume panel has enough height to compare bars. If a setting makes any of those harder to see, undo it.
Save the chart, then test the workspace
A watchlist and a chart layout serve different purposes. Your watchlist stores the collection of symbols you want to navigate. A chart layout stores the chart configuration you want to return to. In TradingView’s Create, Manage, and Save Chart Layouts: Full Demonstration, watch only the portions needed to create and check a basic layout. The presenter uses other instruments and timeframes; copy the controls, not those choices.
Create, Manage, and Save Chart Layouts: Full Demonstration
Watch TradingView’s layout demonstration to see where layouts are managed, how a new one is named, and what autosave does.
Watch layout controls for the menu and what a layout stores. Skip to create and save for a new layout, its name, and the saved-changes indicator. Finally, watch last viewed symbol: changing tickers can change which chart the layout reopens on, even if the layout’s name mentions another ticker.
Use the chart’s layout menu to save a layout named, for example, Indian equities — clean intraday. Confirm that saving has completed; whether you see an explicit Save control or an autosave indicator depends on your interface. Do not name the layout after a single stock unless you intend to keep it tied to that stock: the video shows that a saved layout can reopen on the last symbol viewed.
Now perform a short verification:
- Confirm that your named watchlist contains the intended stocks with the intended exchange, without an accidental index, option, or future.
- Switch between two watchlist stocks. Check that the chart title changes while the candlestick interval, volume panel, and readable appearance remain useful.
- Leave the chart or reload it, then reopen your saved layout and watchlist. Confirm what persisted. If anything did not, save it again while signed in and recheck the relevant menu.
TradingView’s visible prices and data availability may differ by instrument, account, and data subscription. If you later use the workspace for time-sensitive decisions, verify the market-data status rather than assuming every quote is live. Saving a chart or watchlist does not place an order.
Key takeaways
You now have two distinct parts of a basic trading workspace: a verified NSE stock watchlist for navigation and a clean saved chart layout for observation. Always confirm the instrument type and exchange, keep price and volume readable, and test what your account actually saves.
This completes the foundations module. Next, you will study order types and execution—the mechanics that matter if you move from observing a price on a chart to simulating an entry or exit.