Recommended resources
The freely available resources this lesson will direct you to.
Hello! Let's continue our exploration of bot management systems.
In our previous lesson, we designed an active fingerprinting system to create a detailed, static snapshot of a client's device and browser. This is excellent for identifying clients that are trying to spoof their identity. However, a sophisticated bot might use a real, unmodified browser, giving it a perfect fingerprint. To catch such bots, we need to move beyond static snapshots and analyze their behavior over time.
This brings us to today's learning outcome: Design a telemetry collection system for behavioral analysis, efficiently capturing user interactions like mouse movements and keystrokes.
We will architect a system that can continuously monitor how a user interacts with a webpage. This involves capturing high-frequency events, designing efficient client-side logic to handle this data deluge, and architecting a scalable backend pipeline to ingest and process it.
1. Client-Side Capture: Listening to User Interactions
The first step is to capture the raw user interactions in the browser. We can achieve this using JavaScript event listeners attached to the document. The two most important events for behavioral analysis are mousemove and keydown.
Detecting DoS Attacks through Synthetic User Behavior
To see how this is implemented at a fundamental level, let's examine a research paper that built a similar telemetry system. The 'Testing Environment' section and its accompanying algorithm provide a clear, first-principles blueprint for capturing these events.
Please read the section '3. Testing Environment' and study 'Algorithm 1: Telemetry Data Collection'. Pay close attention to: Which events are being captured (KeyDown, MouseMove). What data is collected for each event (timestamp, coordinates). How the data is sent to the server (a POST request to a tracking endpoint). \nThis simple pseudocode represents the core logic of our client-side collector.
As you saw in the paper, the basic idea is straightforward. For every mouse movement, we capture its (x, y) coordinates and a timestamp. For every key press, we capture the key and a timestamp. However, a significant engineering challenge arises immediately: mousemove events can fire at a very high rate—often over 100 times per second. Sending a separate HTTP request for each event would overwhelm both the client's browser and our backend servers.
This is the central problem we must solve: how to collect this rich behavioral data efficiently.
2. Taming the Flood: Efficient Client-Side Data Handling
To manage the high volume of telemetry data, we need to employ strategies on the client side to reduce the amount of data sent over the network. This involves batching, sampling, and compression.
[PDF] Compressing mouse cursor activity for web analytics
The problem of capturing mouse movements efficiently is well-studied in the field of web analytics. This research paper, 'Compressing mouse cursor activity for web analytics,' provides a rigorous evaluation of various techniques to solve this exact problem. It's a goldmine of design trade-offs for our system.
Please read the following sections to understand the core strategies for data reduction: Introduction: This sets the stage by quantifying the data overhead problem. Cursor tracking systems in academia: This section reviews several sampling methods used in practice. Focus on the concepts of distance-based, time-based, and pause-based sampling. Lossy compression: This section formalizes the sampling techniques. Pay close attention to the descriptions of Distance Thresholding (IDT), Time-Based Polling (TBP), and Pause-Based Polling (PBP). These are our primary tools for intelligently reducing data volume. Performance and other considerations (from Section 6): Skim this section to understand the recommendations for asynchronous requests and persistent connections, which are good engineering practices for building this kind of system.
The paper you just read introduces several critical design patterns for our telemetry collector. Instead of naively sending every event, we can design a more intelligent client-side agent.
Design Choices for Data Reduction
Our client-side script should buffer events locally and apply reduction techniques before batch-sending them to the server. Here are the key trade-offs:
- Time-Based Polling (TBP): Sample the cursor position every N milliseconds (e.g., 100ms).
- Pro: Simple, predictable data volume.
- Con: May miss important rapid movements between samples or over-sample during pauses.
- Distance Thresholding (IDT): Only record a point if the cursor has moved more than R pixels from the last recorded point.
- Pro: Efficiently captures the path's geometry without redundant points.
- Con: Doesn't capture pauses, where a user might be reading or thinking.
- Pause-Based Polling (PBP): Record a point only when the time between consecutive
mousemoveevents exceeds a threshold T.- Pro: Excellent for capturing where a user's attention is focused (i.e., where they stop the cursor).
- Con: Misses the trajectory of the movement itself.
In practice, a robust system often uses a hybrid approach. For example, you could use IDT to capture the general path and supplement it with PBP to ensure moments of hesitation are recorded.
Data Compression
After sampling, we can compress the data further before sending it. One of the most effective techniques for sequential data like this is Delta Encoding. Instead of sending a series of absolute coordinates (x1, y1, t1), (x2, y2, t2), ..., we send the initial state and then only the differences (deltas) between subsequent states: (x1, y1, t1), (dx, dy, dt), ....
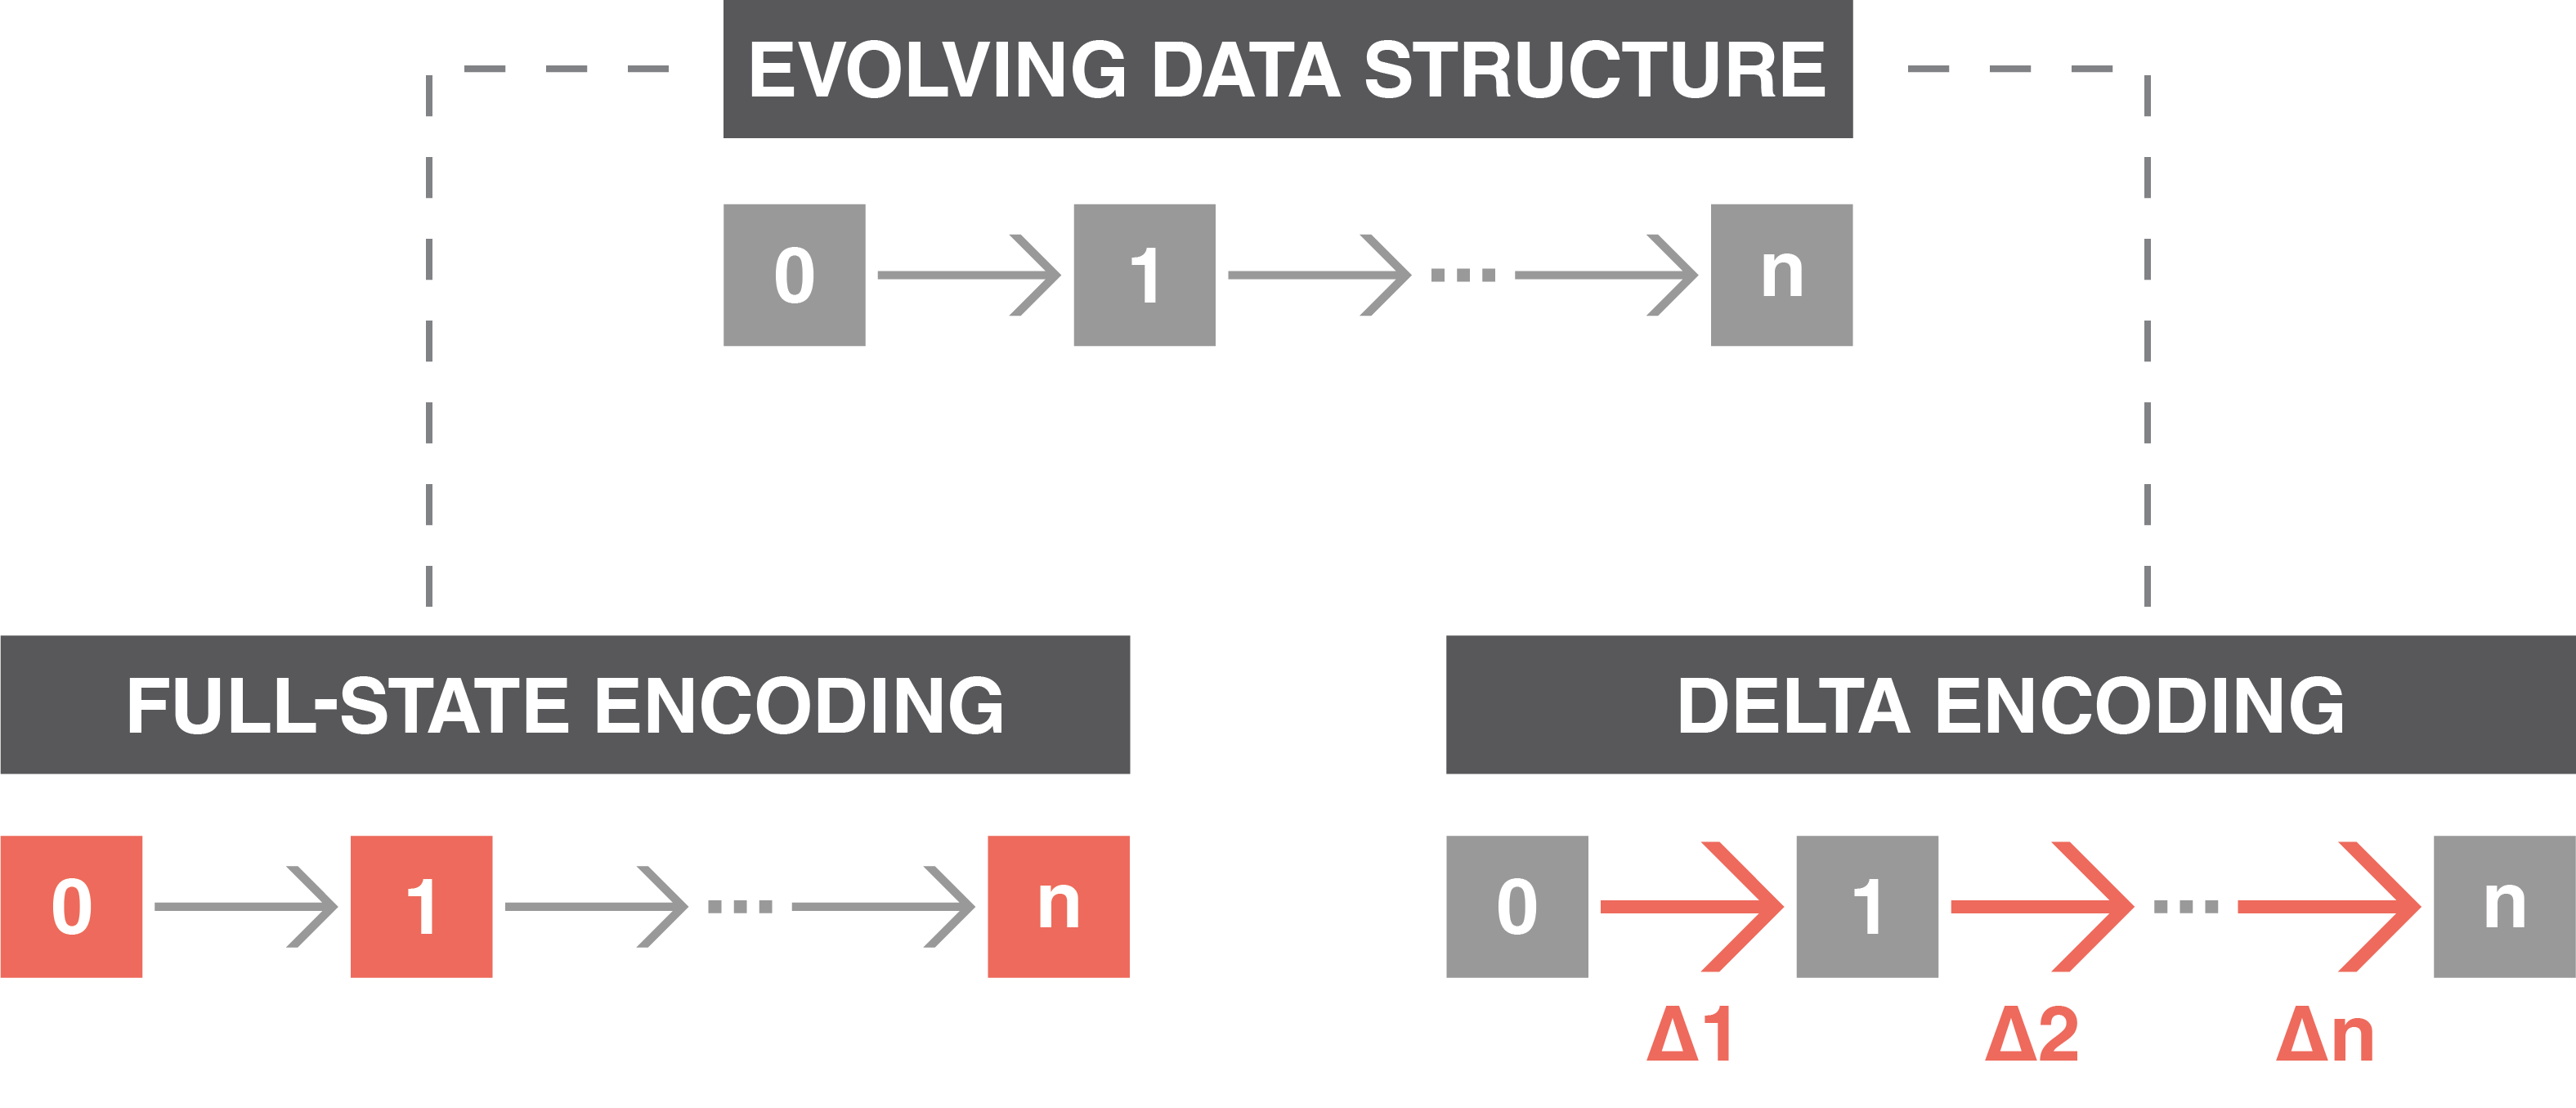
Since the changes between samples are often small, they can be represented with fewer bytes, leading to significant compression. This aligns with the "first principles" approach of understanding the structure of your data to optimize it.
Our client-side telemetry agent's logic is now more sophisticated:
- Listen for
mousemoveandkeydownevents. - Buffer these events in a local array.
- Apply sampling techniques (e.g., IDT) to the buffered events to reduce redundancy.
- Periodically (e.g., every 5 seconds or when the buffer reaches a certain size), apply delta encoding to the sampled events.
- Send the compressed, batched payload to the ingestion server via a single asynchronous
POSTrequest.
3. Architecting the Backend Ingestion Pipeline
Now that we have a strategy for sending batched, compressed data from the client, we need to design a backend capable of receiving and processing it at scale. Given your background in distributed systems, this architecture will look familiar, but we'll tailor it for the specific needs of security telemetry.

Let's design a more detailed version of this pipeline. We need it to be highly available, scalable, and capable of handling spiky traffic.
Distributed Metrics/Logging Design Deep Dive with Google SWE! | Systems Design Interview Question 14
The architecture for a high-throughput telemetry system shares many patterns with distributed logging and metrics systems. This video provides an excellent deep dive into designing such a system, which we can adapt directly for our behavioral telemetry pipeline.
Please watch the following segments, thinking about how each component would apply to our stream of mouse and keyboard data: Message Broker (04:42 - 06:35): Focus on the reasons for choosing a log-based message broker like Kafka (durability, replayability). Stream Processing (06:42 - 09:21): Understand the concepts of enrichment (e.g., adding user or device fingerprint info to the telemetry) and time-based aggregations. Storage (10:40 - 15:16): Pay attention to the different storage destinations and their purposes: Time-Series Databases for real-time queries and Data Lakes (like S3) for raw storage and batch processing. Diagram (17:39 - 19:57): This brings all the components together into a complete architectural diagram.
Based on the video and our requirements, here is the architecture for our telemetry collection system:
-
Ingestion Service: A horizontally scalable, load-balanced fleet of servers that act as the public endpoint for our client-side scripts. Their only job is to receive the compressed telemetry blobs, perform basic validation, and publish them to a message queue.
-
Message Queue (e.g., Kafka): This is the backbone of our pipeline. It decouples the ingestion service from the processing services. Its durability ensures we don't lose data even if downstream consumers fail, and its log-based nature allows us to "replay" event streams for debugging or reprocessing—a critical feature for security systems.
-
Stream Processing Layer (e.g., Flink, Spark Streaming): A set of services that consume the raw telemetry from Kafka. Their responsibilities include:
- Decompression & Parsing: Reversing the delta encoding and parsing the event batches.
- Normalization: Structuring the data into a consistent format.
- Enrichment: This is a crucial step. The stream processor can fetch the static device fingerprint we collected in the last lesson (keyed by a session ID, for instance) and join it with the behavioral data. Now, each mouse movement is associated with the device that made it.
-
Storage Layer: The processed and enriched telemetry is fanned out to multiple destinations based on use case:
- Time-Series Database (e.g., InfluxDB, TimescaleDB): For hot data that needs to be queried in near real-time, such as for live session monitoring dashboards.
- Data Lake (e.g., S3, GCS): For cost-effective, long-term storage of all raw and enriched telemetry. This data becomes the training set for the machine learning models we will design in the next lesson.
- Real-time Analysis Engine: The stream processor can also feed data directly to a system that analyzes behavior on the fly to detect anomalies.
This architecture is robust, scalable, and provides the flexibility needed for a sophisticated bot detection platform.
Conclusion
In this lesson, we have designed an end-to-end system for collecting behavioral telemetry, addressing the significant engineering challenge of high data volume.
Key Takeaways:
- Behavioral Telemetry: Capturing continuous interactions like mouse movements and keystrokes provides dynamic signals that are harder for bots to fake than static fingerprints.
- Efficient Client-Side Capture: The key to success is handling data volume on the client. We use a combination of batching, sampling (TBP, IDT, PBP), and compression (Delta Encoding) to reduce network load.
- Scalable Ingestion Pipeline: The backend architecture relies on standard distributed systems patterns: a stateless ingestion service, a durable message queue (Kafka) for decoupling, a stream processing layer for enrichment, and a multi-tiered storage system for different access patterns.
- Design is about Trade-offs: The choice of sampling technique (e.g., TBP vs. IDT) depends on what aspects of user behavior you want to prioritize, balancing data fidelity against performance.
Preview of the Next Lesson:
We have now designed the systems to collect both static fingerprints and continuous behavioral streams. But how do we turn this mountain of data into a simple "bot" or "not bot" decision? In our next lesson, we will tackle the next outcome: "Design a feature engineering pipeline and compare heuristic vs. ML-based approaches for behavioral bot detection." We will explore how to extract meaningful features from these data streams and build the logic that powers the detection engine.