Recommended resources
The freely available resources this lesson will direct you to.
Hello. In the previous lesson, you diagnosed how organization design, accountability, delegation, talent, succession, and conflict affect delivery outcomes. That diagnosis often produces the next Director-level question: given limited people, time, and budget, what should we fund, defer, or stop?
This lesson develops a practical answer. You will learn to turn a delivery or investment problem into a concise one-page recommendation that makes the capacity gap visible, compares credible staffing options, quantifies expected value without pretending certainty, identifies risk and opportunity cost, and asks for a clear decision. This is particularly relevant for release-readiness and infrastructure organizations, where urgent customer issues, reliability work, roadmap commitments, and automation investments compete for the same scarce experts.
Start with the decision, not a headcount request
A weak resource request sounds like:
“We are overloaded and need two more engineers.”
A Director-level recommendation sounds like:
“Approve one six-month test-automation specialist to preserve a reliability investment that has greater expected value than its cost, while protecting the committed release. Review at week four before committing the remaining contract spend.”
The difference is significant. The first statement describes a feeling of shortage. The second specifies:
- the business decision required;
- the outcome that additional capacity protects;
- the investment and time horizon;
- the alternative being rejected or delayed;
- the evidence behind the recommendation;
- the control point if assumptions prove wrong.
Resource allocation is therefore not merely staffing administration. It is a strategic choice about where an organization places its finite ability to act.
A useful opening structure is:
- Decision requested: What approval or prioritization decision is needed?
- Objective and constraints: What outcome must be protected, and what cannot be compromised?
- Capacity position: What work is demanded, what usable capacity exists, and where is the gap?
- Options: What are the realistic ways to close the gap?
- Recommendation: Which option best fits strategy, economics, timing, and risk?
- Conditions and measures: What assumptions, owners, milestones, and triggers will govern execution?
The “business as usual” option must always be visible. If leaders do nothing, work does not disappear; it is delayed, done at lower quality, displaced by escalations, or absorbed through unsustainable overtime. That outcome is a real option with a real cost.
Establish the capacity gap: usable capacity, not headcount
The capacity-planning process begins by comparing anticipated demand with available supply. The visual below captures the essential sequence: forecast demand, determine required capacity, calculate current capacity, measure the gap, and align capacity with demand.
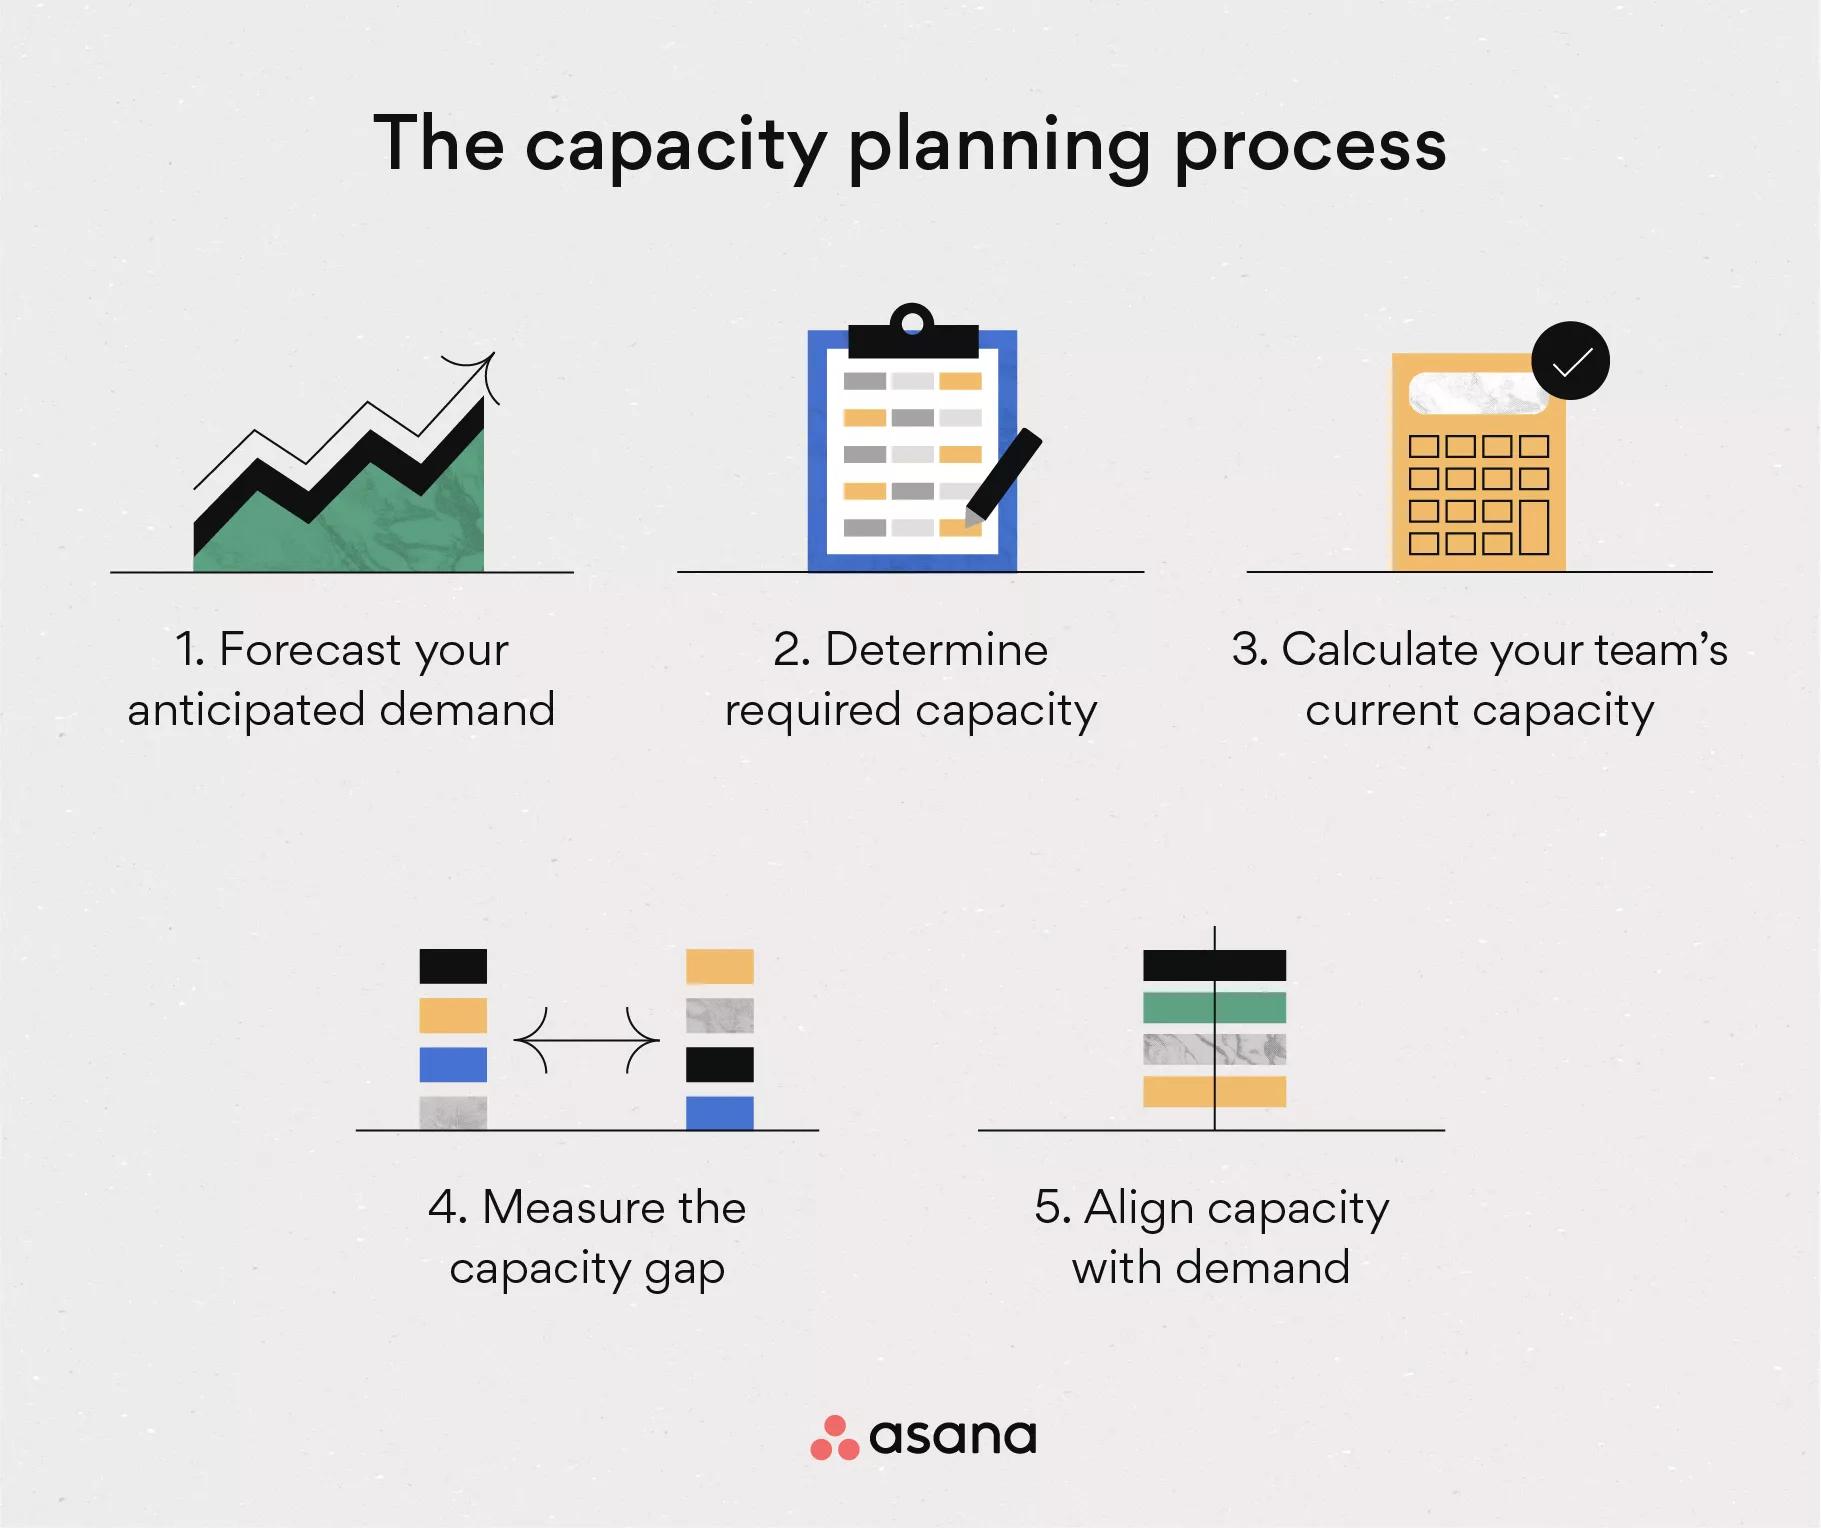
A headcount number is not a capacity plan. A team of 14 engineers does not necessarily provide 14 full-time equivalents for new roadmap work. Some capacity is already committed to production support, customer escalations, people management, release operations, leave, required training, and coordination. Further, capacity has a skill and timing dimension: one database performance specialist cannot automatically substitute for a release-validation engineer, and a hire who arrives in four months does not solve a next-quarter release risk.
Capacity Planning: Process, Strategies & Team success [2026] • Asana
Read Asana’s practical overview to distinguish capacity planning from a generic workload conversation. Its workflow is useful for estimating demand, identifying bottlenecks, and choosing whether to add capacity before, after, or gradually alongside demand.
In the opening section, “What is capacity planning?”, read the definition and note its three dimensions: people, time, and budget. Then read the full subsection “The capacity planning process,” beginning with the seven-step workflow. Pay particular attention to forecasting demand, calculating current capacity, identifying bottlenecks, and monitoring the plan rather than treating it as a one-time estimate. Finally, in “Capacity planning strategies” and “Workforce capacity planning,” read the lead, lag, and match approaches, then connect them to staffing choices such as hiring, contractors, redeployment, and deferral.
A capacity model for an engineering organization
Use a common unit. For quarterly or half-year planning, FTE-months are usually more useful than individual task hours. One FTE-month is roughly one person’s productive contribution for one month, adjusted for realistic availability.
A simple starting calculation is:
For example, imagine an infrastructure release-quality group with 14 engineers planning across the next two quarters. Historical data indicates that, after customer support, release duties, leave, mandatory work, and normal coordination, only of nominal engineering time is available for this portfolio.
The demand forecast might be:
| Work category | Required capacity | Why it matters |
|---|---|---|
| Release validation and upgrade readiness | 7 FTE-months | Protects the committed enterprise release |
| Strategic customer fixes | 4 FTE-months | Limits escalation and renewal risk |
| Cloud dependency upgrade | 5 FTE-months | Removes a supportability and security constraint |
| Regression-test automation | 6 FTE-months | Reduces recurring validation effort and defect escape risk |
| Unplanned-work reserve | 3 FTE-months | Absorbs likely late issues without breaking commitments |
| Total demand | 25 FTE-months |
The gap is:
This calculation is deliberately simple, but it changes the leadership conversation. The team is not “generally busy.” It has a defined four-FTE-month shortfall against a stated portfolio.
Do not plan at 100 percent utilization
The three FTE-month reserve in the example is not waste. It is an explicit allowance for uncertainty in a release and customer-facing organization. Removing it may make the spreadsheet appear balanced, but it simply transfers risk into late escalation, schedule slippage, quality reduction, or burnout.
A sound recommendation distinguishes:
- Committed work: contractual, customer, safety, security, or executive commitments.
- Strategic work: investments that create future capability, revenue, differentiation, or reliability.
- Operational work: support, incident response, compliance, and release obligations.
- Contingency capacity: a limited reserve for probable unplanned demand.
- Optional work: valuable initiatives that can be deferred without violating a hard commitment.
This classification matters because not every item should be treated as equally immovable. A team that labels all work “critical” has not prioritized; it has only moved the conflict later in time.
Turn a gap into credible staffing and scope options
A capacity gap has multiple possible responses. Adding headcount is only one of them.
| Option | Capacity effect | Best use | Main limitation |
|---|---|---|---|
| Defer or reduce scope | Reduces demand | Low-value or reversible work; uncertain demand | Creates opportunity cost and may defer risk reduction |
| Redeploy internal talent | Shifts existing supply | One initiative has materially lower value | Delays another strategic outcome |
| Contract specialist capacity | Adds temporary, targeted supply | Defined work with scarce skills and a short horizon | Ramp-up, knowledge transfer, quality, and vendor-dependency risks |
| Hire permanent staff | Adds durable supply | Sustained demand and a continuing capability need | Hiring lead time means limited near-term relief |
| Automation or tooling | Reduces future demand | Repetitive work with stable patterns | Requires near-term investment before benefits arrive |
| Change operating model | Removes coordination waste or rework | Repeated handoff, decision, or quality failures | Benefits may take time and are harder to estimate |
| Accept the risk | Does not close the gap | Low-impact, recoverable work | Must be explicit; it is not “free” |
These options represent different capacity strategies:
- Lead capacity: invest before demand arrives. For example, hire or train ahead of a known platform transition.
- Lag capacity: add supply after demand materializes. For example, bring in support help after a demand surge.
- Match capacity: add or remove capacity incrementally as evidence improves.
For the example release-quality group, a match strategy is likely appropriate. The next two quarters contain a known workload peak, but the longer-term level of customer-fix demand remains uncertain. A temporary specialist can address a specific gap while preserving the option to make a permanent hire only if the demand persists.
The full cost of an option
Cost is more than base salary or a contractor’s stated rate. A resource recommendation should include the relevant economic cost of the decision:
- salary, contractor fees, benefits, and equipment where applicable;
- recruitment, onboarding, training, and access-provisioning effort;
- manager and senior-engineer time needed to supervise or enable the person;
- infrastructure, software, test environments, or licenses;
- recurring operating cost, not merely initial setup cost;
- costs transferred to another team or customer;
- the value lost by delaying another initiative.
For a short, executive recommendation, use ranges where precision is weak. “USD 140,000 to USD 180,000 fully loaded” is more honest and more useful than “USD 163,742” based on incomplete assumptions.
Compare expected value, risk, and opportunity cost
Financial thinking at Director level does not require claiming that every engineering benefit can be monetized perfectly. It requires showing that you can compare options consistently, distinguish facts from assumptions, and make risk explicit.
A helpful concept is expected value:
Here, is the estimated probability of outcome , and is the value associated with that outcome. Expected value is especially useful when a proposal has uncertain outcomes, such as avoided incidents, reduced rework, customer retention, or earlier time to market.
For instance, suppose the automation initiative is expected to create USD 800,000 in annual value through lower regression effort, fewer urgent defect investigations, and reduced exposure to costly release delays. Based on evidence from comparable releases, the team estimates a chance that the initiative will achieve that benefit. Deferring it six months means losing half of the annual benefit. If a contractor has an probability of becoming productive quickly enough to prevent the deferral, the expected value of advancing the work is:
If the fully loaded contractor cost is USD 160,000, the modeled expected net value is:
This is not a guarantee of return. It is a transparent model whose assumptions can be challenged. The recommendation should name the evidence behind each assumption and state what would change the decision.
The Green Book (2026) - GOV.UK
The UK government’s Green Book is written for public-sector appraisal, but its discipline transfers well to corporate investment choices: establish objectives, compare options against a baseline, include risk and uncertainty, and present a balanced recommendation rather than relying on one attractive metric.
In the appraisal discussion, read the criteria for narrowing options. Translate “critical success factors” into non-negotiables for an infrastructure decision, such as release safety, strategic-customer commitments, security obligations, or delivery timing. In the “Risk and uncertainty” section, read why uncertainty belongs in the appraisal, followed by the expected-value method. Focus on the distinction between a probability-informed estimate and false certainty. Finally, in “Appraisal summary tables,” read the rationale for a one-page summary. Notice that it includes non-monetizable effects and risk alongside financial measures.
Expected value is necessary, but not sufficient
Some consequences should not be hidden inside an uncertain financial model:
- customer trust after a major release failure;
- regulatory or security exposure;
- loss of a scarce technical capability;
- sustained burnout among critical employees;
- strategic dependence on a vendor or a single internal expert;
- a delayed product position in a market window.
These are non-monetizable or weakly monetizable considerations. Include them plainly. A recommendation is stronger when it says, “This option has the highest modeled return, but it is unacceptable because it violates the security remediation deadline,” than when it gives a misleadingly precise financial calculation.
A good decision also separates three distinct ideas:
| Concept | Meaning | Example |
|---|---|---|
| Cost | Resources consumed by the chosen option | USD 160,000 for a six-month specialist contractor |
| Risk | Uncertainty that can affect objectives | Contractor may need longer to learn the test environment |
| Opportunity cost | Value lost because capacity is not used for the next-best alternative | Delaying automation leaves six months of recurring regression work in place |
The opportunity cost of “do nothing” is often the most important number in a resource debate. Deferring automation may save current-quarter cash, but it can perpetuate manual work, delay future releases, and make quality dependent on heroic effort. Conversely, funding a contractor may protect automation but delay a platform observability pilot. Both are costs; only one appears directly in the team budget.
Build the one-page recommendation
A one-page recommendation is not a compressed project plan. It is a decision document for a busy executive who needs the rationale, alternatives, decision request, and downside quickly.
How To Write A Business Case...
Watch “How To Write A Business Case...” from Proper Project Management for a compact view of how an executive summary and cost-of-inaction section make an investment proposal decision-ready.
Watch the executive summary to see why a senior audience needs the objective, boundaries, expected benefits, and core recommendation immediately. Then watch cost of inaction for the role of viability, strategic fit, and the consequence of declining the proposal.
Use the following structure. It fits in one page if each section is concise and evidence-led.
One-page resource-allocation template
| Section | What to write |
|---|---|
| Decision requested | State the exact approval, amount, duration, and accountable owner. |
| Objective and non-negotiables | Name the business outcome and hard constraints, such as release date, security commitment, customer obligation, or spending ceiling. |
| Capacity position | Show demand, usable capacity, the gap, key skill bottleneck, and planning horizon. |
| Options compared | Include business as usual plus two or three genuinely viable alternatives. |
| Economics | State incremental cost, expected benefits, expected net value or cost-effectiveness, and the assumptions behind the figures. |
| Risks and mitigations | Identify the major risks, their effect, and the mitigation or escalation trigger. |
| Opportunity cost | State what is delayed, reduced, or foregone under the recommended option and under the baseline. |
| Recommendation and review cadence | Make the choice, name milestones, set a decision owner, and define when the investment will be reassessed. |
Worked example: release-quality investment decision
The following is a confidentiality-safe illustration of how the earlier capacity analysis could become an executive one-pager.
Decision requested
Approve up to USD 160,000 for one six-month specialist contractor in test automation, accountable to the Quality and Upgrade Validation Manager. The contractor begins only after a four-week onboarding plan and work package are approved.
Objective and constraints
Protect the committed enterprise release, strategic-customer fixes, and cloud dependency upgrade while completing the regression automation investment this half-year. Do not reduce defined release-blocker criteria or remove the three-FTE-month contingency reserve.
Capacity position
| Item | FTE-months over two quarters |
|---|---|
| Forecast demand | 25 |
| Usable internal capacity | 21 |
| Gap | 4 |
| Bottleneck | Automation expertise and validated test-environment access |
Options
| Option | Capacity effect | Incremental cost | Expected consequence |
|---|---|---|---|
| Business as usual: defer automation | Closes gap by reducing demand | USD 0 | Automation value deferred by six months; expected opportunity cost about USD 280,000 |
| Redeploy internal engineers from observability pilot | Adds 4 FTE-months | USD 0 direct cost | Meets delivery need but delays telemetry capability; estimated opportunity cost about USD 250,000 |
| Contract automation specialist | Adds 4 effective FTE-months after ramp-up | USD 160,000 | Preserves all committed work and advances automation; modeled expected value about USD 224,000 |
| Hire permanent engineer now | Adds about 2 FTE-months in period | About USD 250,000 annualized cost | Too slow for the current release window; reconsider if demand persists |
Recommendation
Choose the specialist contractor. Relative to business as usual, the modeled expected net value is approximately USD 64,000, while it preserves both the release commitment and a capability-building automation investment. A permanent hire is not recommended for this immediate gap because hiring lead time makes it economically weak over the current planning horizon.
Principal risks and controls
| Risk | Control |
|---|---|
| Contractor ramp-up is slower than forecast | Four-week readiness checkpoint; release the remaining spend only if agreed automation milestones are met |
| Domain knowledge remains external | Assign an internal technical owner; require documentation, paired implementation, and knowledge-transfer acceptance criteria |
| Security or customer-data exposure | Use sanitized test data, least-privilege access, and existing vendor onboarding controls |
| Demand falls unexpectedly | Treat the contract as time-bound; do not convert to permanent headcount without the next planning-cycle evidence |
Measures and review cadence
Review biweekly. By week four, confirm environment access, first automated workflow, and forecast productivity. By the end of the half-year, measure automated regression coverage, validation cycle time, escaped-defect trend, and hours of manual regression effort avoided.
This example is intentionally modest in its claimed return. A recommendation does not need an enormous financial ratio to be credible. It needs a sound comparison against alternatives, transparent assumptions, and a risk-managed way to learn quickly.
Quality checks before presenting the recommendation
Before sending the one-pager, test it with these questions:
- Could a senior leader state the decision needed after reading the first two sentences?
- Is the capacity gap based on usable, skill-matched capacity rather than nominal headcount?
- Does the baseline show what happens if no new investment is approved?
- Have you compared at least one scope or sequencing option, not just “hire versus do nothing”?
- Are cash cost, recurring cost, management overhead, and opportunity cost separated?
- Are expected-value assumptions traceable to evidence, historical data, or clearly labeled judgment?
- Have you named non-monetizable considerations that could override the financial result?
- Does the recommendation include a checkpoint that limits downside if the assumptions fail?
- Is there one accountable owner for execution and a defined review cadence?
For external Director, Senior Manager, or Principal TPM interviews, the quality of this reasoning matters at least as much as the arithmetic. Interviewers are testing whether you can protect critical commitments while reallocating constrained people and funds toward the work that creates the greatest organizational value.
Key takeaways
A resource-allocation recommendation is a strategic decision document, not a request for additional headcount.
- Start with the decision, objective, constraints, and baseline outcome.
- Calculate usable capacity in a common unit such as FTE-months; account for skills, timing, operational load, and contingency.
- Compare realistic options: reduce demand, redeploy, contract, hire, automate, redesign the operating model, or explicitly accept risk.
- Assess full cost, including onboarding, management attention, recurring spend, and the value of work displaced elsewhere.
- Use expected value to make uncertainty explicit, but do not conceal customer trust, security, capability, or burnout risks inside a questionable financial model.
- Make opportunity cost visible. Deferring or declining an investment is still a resource-allocation choice.
- End with a clear recommendation, accountable owner, milestone-based controls, and a review cadence.
Next, you will apply similar decision discipline to an infrastructure product opportunity: defining the customer problem, assessing discovery evidence, prioritizing competing investments, choosing outcome metrics, and translating the decision into roadmap implications.