Recommended resources
The freely available resources this lesson will direct you to.
Hello. In the previous lesson, you created a reproducible Python project with an isolated environment, source modules, notebooks, tests, and Git history. Now that structure needs a reliable representation of market data.
For a swing-trading research workflow, the central question is not merely “can pandas read a CSV?” It is: what does one row mean, and can every later calculation identify the correct stock and exchange session? This lesson establishes that discipline for multi-stock daily price data. You will load a price panel, build a meaningful index, select useful slices, and join prices to reference data without silently changing the dataset’s meaning.
Study time: about 40 minutes.
Start with the grain of the data
A single-stock daily-price table is straightforward:
| date | open | high | low | close | volume |
|---|---|---|---|---|---|
| 2024-01-02 | 2450 | 2480 | 2442 | 2472 | 1,230,000 |
Once several stocks are involved, a date alone is no longer enough to identify a row. 2024-01-02 could appear once for RELIANCE, once for INFY, once for TCS, and so on.
For most research and backtesting work, use a long panel in which each row represents:
one instrument on one exchange session.
A practical schema is:
| symbol | date | open | high | low | close | volume |
|---|---|---|---|---|---|---|
| RELIANCE | 2024-01-02 | 2450 | 2480 | 2442 | 2472 | 1,230,000 |
| INFY | 2024-01-02 | 1502 | 1520 | 1495 | 1514 | 2,100,000 |
| RELIANCE | 2024-01-03 | 2470 | 2491 | 2460 | 2483 | 1,040,000 |
The pair (symbol, date) is the row’s key. It should be unique: two daily OHLCV records for the same symbol and date are ambiguous until you determine why they exist.
This long layout stays manageable as the universe grows. It also matches the work you will do later: calculate a feature separately for each symbol, filter candidates on a date, then rank them cross-sectionally.
A wide representation can still be useful for specific tasks. For example, closing prices arranged with dates as rows and symbols as columns are convenient for a correlation matrix. But a wide structure is usually a derived analytical view, not the canonical stored form of OHLCV data.
The official pandas documentation below is a focused reference for the loading options used throughout this lesson.
pandas.read_csv — pandas 2.3.3 documentation - PyData |
Read the official pandas documentation to understand how read_csv controls column selection, date parsing, data types, and indexing.
In the Parameters section, focus on usecols, dtype, index_col, and parse_dates. Read the indexing description to see why multiple columns can form a hierarchical index. Then go to Examples and read the date parsing example. Notice that ordinary CSV input is not automatically a date-aware time series.
Load data deliberately, not optimistically
Assume you have a consolidated file at data/daily_prices.csv with lower-case columns:
date,symbol,open,high,low,close,volume
2024-01-02,RELIANCE,2450.0,2480.0,2442.0,2472.0,1230000
2024-01-02,INFY,1502.0,1520.0,1495.0,1514.0,2100000
2024-01-03,RELIANCE,2470.0,2491.0,2460.0,2483.0,1040000
A quick exploratory load might be:
import pandas as pd

prices_raw = pd.read_csv(
    "data/daily_prices.csv",
    usecols=["date", "symbol", "open", "high", "low", "close", "volume"],
    parse_dates=["date"],
    date_format="%Y-%m-%d",
    dtype={
        "symbol": "string",
        "open": "float64",
        "high": "float64",
        "low": "float64",
        "close": "float64",
        "volume": "Int64",
    },
)

prices_raw.info()
Several choices are intentional:
usecolsrejects irrelevant or accidentally renamed columns rather than bringing everything into the research dataset.parse_datesasks pandas to makedatea datetime-like column suitable for time-aware selection and sorting.date_format="%Y-%m-%d"records the expected input format explicitly.dtypeprevents pandas from guessing that a symbol is numeric or that an identifier-like field is something else.
For daily equity bars, date usually means the trading-session label, not a precise timestamp. Time zones and intraday session boundaries become important later; for now, do not invent a time or localize these daily labels.
Before treating this table as a panel, inspect it:
print(prices_raw.head())
print(prices_raw.dtypes)
print(prices_raw[["symbol", "date"]].isna().sum())

duplicate_rows = prices_raw.duplicated(["symbol", "date"], keep=False)
print(prices_raw.loc[duplicate_rows].sort_values(["symbol", "date"]))
A duplicate key is not a harmless formatting problem. It can double-count volume, create incorrect joins, and later distort returns or positions. Stop and investigate it rather than dropping records automatically.
For reusable code, move this behavior out of the notebook and into the project package created in the previous lesson. For example, src/swing_research/market_data.py could contain:
from pathlib import Path

import pandas as pd


PRICE_COLUMNS = [
    "date",
    "symbol",
    "open",
    "high",
    "low",
    "close",
    "volume",
]


def load_daily_prices(path: str | Path) -> pd.DataFrame:
    """Load uniquely keyed daily OHLCV data indexed by symbol and date."""
    prices = pd.read_csv(
        path,
        usecols=PRICE_COLUMNS,
        parse_dates=["date"],
        date_format="%Y-%m-%d",
        dtype={
            "symbol": "string",
            "open": "float64",
            "high": "float64",
            "low": "float64",
            "close": "float64",
            "volume": "Int64",
        },
    )

    prices["symbol"] = prices["symbol"].str.strip().str.upper()

    if not pd.api.types.is_datetime64_any_dtype(prices["date"]):
        raise ValueError("date column must contain valid YYYY-MM-DD dates")

    if prices[["symbol", "date"]].isna().any().any():
        raise ValueError("symbol and date must not be missing")

    if prices["symbol"].eq("").any():
        raise ValueError("symbol must not be blank")

    if prices.duplicated(["symbol", "date"]).any():
        raise ValueError("symbol and date must be unique")

    return (
        prices
        .sort_values(["symbol", "date"])
        .set_index(["symbol", "date"])
        .sort_index()
    )
This loader does not yet decide whether an OHLC value is economically plausible or whether an exchange session was missing. Those are important data-quality problems, but they belong to the later historical-data pipeline module. At this stage, establish the dataset’s schema and key unambiguously.
Build a MultiIndex that reflects the key
After calling set_index(["symbol", "date"]), the DataFrame has a MultiIndex:
prices = load_daily_prices("data/daily_prices.csv")

print(prices.index.names)
print(prices.index)
Conceptually, its index looks like:
MultiIndex([
    ("INFY",     "2024-01-02"),
    ("RELIANCE", "2024-01-02"),
    ("RELIANCE", "2024-01-03"),
    ...
], names=["symbol", "date"])
symbol is the outer index level and date is the inner level. This arrangement is useful because many operations naturally begin with “for each stock, over time.” Sorting is essential: date-range selection within each symbol is clearer, reliable, and efficient when the index is sorted.
The following short video gives a visual walkthrough of creating, sorting, selecting from, and joining MultiIndex DataFrames.
How do I use the MultiIndex in pandas?
Watch Data School’s “How do I use the MultiIndex in pandas?” for a compact visual model of the index structure used in a multi-stock panel.
Watch creating and sorting to see how two ordinary columns become a MultiIndex DataFrame. Then watch basic selection, focusing on the difference between selecting an outer level and selecting a complete (symbol, date) key. Finish with index based merging to see how independently prepared DataFrames can be aligned on their shared index.
The most useful inspection commands are simple:
prices.head()
prices.tail()
prices.index.is_unique
prices.index.get_level_values("symbol").unique()
You want prices.index.is_unique to be True. Treat that as a basic contract of a daily price panel.
Long panel versus wide price matrix
From the indexed long panel, create a wide closing-price matrix only when it serves a particular calculation:
close_wide = prices["close"].unstack("symbol")

print(close_wide.head())
This produces:
| date | INFY | RELIANCE | TCS |
|---|---|---|---|
| 2024-01-02 | 1514 | 2472 | 3560 |
| 2024-01-03 | 1528 | 2483 | 3598 |
unstack("symbol") moves the symbol index level into columns. The operation requires that each (symbol, date) pair identify at most one value; that is another reason uniqueness must be validated before reshaping.
Keep the distinction in mind:
| Form | Best use |
|---|---|
Long OHLCV panel indexed by (symbol, date) |
Per-stock transformations, trade simulation, joins with metadata, auditability |
Wide close-price matrix indexed by date |
Comparing stocks at a point in time, correlations, portfolio-level matrix operations |
Filter the panel without losing its meaning
With a MultiIndex, filtering should make the intended dimensions explicit.
To retrieve all records for one stock:
reliance = prices.loc["RELIANCE"]
The result has a simple date index because pandas has fixed the outer symbol level:
            open    high     low   close   volume
date
2024-01-02  2450.0  2480.0  2442.0  2472.0  1230000
2024-01-03  2470.0  2491.0  2460.0  2483.0  1040000
To choose one symbol, a date range, and selected columns, use an explicit tuple for the row key:
reliance_january = prices.loc[
    ("RELIANCE", slice("2024-01-02", "2024-01-31")),
    ["close", "volume"],
]
For a cross-section, such as closing prices for every stock on one session, use IndexSlice:
idx = pd.IndexSlice

session_snapshot = prices.loc[
    idx[:, pd.Timestamp("2024-01-15")],
    ["close", "volume"],
]
The colon in idx[:, ...] means “all symbols.” This is a common operation in a daily ranking strategy: the strategy will eventually compare every eligible stock using information known at the same decision point.
A typical research filter combines a declared universe, a time window, and a liquidity condition:
universe = ["RELIANCE", "INFY", "TCS"]
start = pd.Timestamp("2024-01-01")
end = pd.Timestamp("2024-03-31")

window = prices.loc[
    (universe, slice(start, end)),
    :
]

liquid_window = window.loc[window["volume"].ge(1_000_000)]
This separates two different ideas:
- the universe filter specifies which symbols are even eligible for analysis;
- the data condition retains rows whose observed volume meets the chosen threshold.
Do not assume that an absent date means a stock “had zero volume.” It might be a market holiday, a data outage, a suspension, or a problem in the download. Later lessons will establish market calendars and explicit missing-data checks.
Join reference data safely
Price bars alone are rarely enough. You may need sector information, an eligibility flag, a benchmark value, or an instrument-token mapping. A join combines these datasets by matching keys.
Before writing a merge, state the grain of every input:
| Dataset | One row means | Key |
|---|---|---|
prices |
One symbol on one date | (symbol, date) |
symbol_meta |
One symbol | symbol |
benchmark |
One benchmark observation on one date | date |
Here is a small reference-data example:
symbol_meta = pd.DataFrame(
    {
        "symbol": ["RELIANCE", "INFY", "TCS"],
        "sector": ["Energy", "Information Technology", "Information Technology"],
        "eligible": [True, True, True],
    }
)

benchmark = pd.DataFrame(
    {
        "date": pd.to_datetime(["2024-01-02", "2024-01-03"]),
        "nifty_close": [21665.8, 21517.4],
    }
)
The relationship between prices and metadata is many-to-one: a symbol appears on many dates in prices, but should appear once in symbol_meta. Likewise, many stock rows share a single benchmark value for a given date.
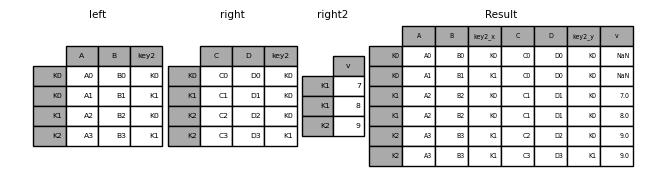
The following merge preserves every price row while adding metadata and a same-date benchmark value:
panel = prices.reset_index()

enriched = (
    panel
    .merge(
        symbol_meta,
        on="symbol",
        how="left",
        validate="m:1",
    )
    .merge(
        benchmark,
        on="date",
        how="left",
        validate="m:1",
        indicator="benchmark_status",
    )
)
Three choices deserve attention.
First, use explicit keys. on="symbol" and on="date" tell pandas exactly which columns define each match. Avoid relying on pandas to infer a key from similarly named columns.
Second, use how="left" when enriching a price panel. A left join keeps all rows from the left table, here panel. If metadata or a benchmark is missing, the new fields become missing values instead of the OHLCV row vanishing silently.
Third, use validate. The setting validate="m:1" asserts that many left-side rows may match one right-side row. If symbol_meta accidentally contains RELIANCE twice, pandas raises an error rather than duplicating every RELIANCE price record.
Common join types have distinct uses:
| Join type | Result | Suitable use |
|---|---|---|
left |
Keeps all price-panel rows | Adding metadata or benchmark fields |
inner |
Keeps only matched rows | Restricting to deliberately verified overlap |
outer |
Keeps all rows from both inputs | Auditing coverage and discovering mismatches |
right |
Keeps all right-side rows | Less common for price-panel research |
After merging, audit the result before dropping diagnostic columns:
if enriched["sector"].isna().any():
    raise ValueError("Some symbols have no metadata mapping")

if not enriched["benchmark_status"].eq("both").all():
    raise ValueError("Some price dates have no benchmark value")
Once the checks pass, restore the panel index:
enriched = (
    enriched
    .drop(columns="benchmark_status")
    .set_index(["symbol", "date"])
    .sort_index()
)
If two DataFrames are already uniquely indexed by the identical (symbol, date) key, an index-to-index join is also appropriate:
panel_with_flags = prices.join(
    quality_flags,
    how="left",
    validate="1:1",
)
Here, quality_flags must itself be indexed by the same two levels and must contain no duplicate keys. This style is useful for adding independently computed flags or features while retaining the panel’s index.
A join should never be treated as a cosmetic operation. It changes the information available on each row. Check row counts, key uniqueness, missing matches, and the declared cardinality every time.
Implementation checkpoint
At the end of this lesson, your notebook should be able to do the following in order:
- Load a multi-stock CSV with explicit columns, types, and date parsing.
- Normalize symbols and reject duplicate
(symbol, date)keys. - Build and sort a
(symbol, date)MultiIndex. - Select one symbol, one date range, or a one-date cross-section.
- Filter an explicit universe using a reproducible condition such as volume.
- Merge symbol-level and date-level reference data with explicit keys and
validate. - Restore the sorted MultiIndex after a column-based merge.
Move a stable version of load_daily_prices into src/swing_research/market_data.py, and add a unit test later with a tiny fixture containing deliberately unsorted rows and a duplicate-key case. That will protect the data contract before feature calculations begin.
Key takeaways
A reliable multi-stock dataset has a clear grain: one symbol on one session. The (symbol, date) MultiIndex expresses that key directly and supports efficient per-stock and per-date selection.
- Load CSVs with explicit parsing assumptions rather than relying on inference.
- Treat duplicate
(symbol, date)values as a data problem to investigate. - Keep OHLCV data in a long, indexed panel; derive wide matrices only for tasks that need them.
- Use
.loc, tuples, andIndexSliceto make symbol and date filters precise. - Join with explicit keys, an intentional join type, and a cardinality check such as
validate="m:1".
Next, you will use this indexed price panel to compute returns, rolling statistics, and lagged features with vectorized pandas and NumPy operations.