Recommended resources
The freely available resources this lesson will direct you to.
Hello! Welcome to our fifth lesson in the "Advanced Debugging Techniques" module.
In our previous lesson, we mastered event listener breakpoints, a fantastic tool for finding which code runs in response to a user action. We learned to let the browser lead us directly to the relevant handler, rather than hunting through the code ourselves.
Today, we extend this idea of debugging code in different contexts. We'll move beyond the main browser thread to tackle web workers and service workers. As an experienced front-end developer, you're likely familiar with using workers to offload heavy computations or manage network requests for PWAs. However, since they run in a separate execution context, debugging them requires a specific set of tools and techniques. This lesson will show you how to open their dedicated DevTools instances and effectively debug code running in the background.
This is the final lesson in our debugging module. We'll be putting together many of the skills we've learned—like setting breakpoints and inspecting scopes—but applying them in these unique worker environments.
Part 1: Debugging Web Workers
Web workers are scripts that run on a background thread, separate from the main execution thread of your web application. This is ideal for long-running tasks that would otherwise block the UI. There are two main types: Dedicated Workers (used by a single script) and Shared Workers (can be shared by multiple scripts/windows).
Debugging Dedicated Workers
Dedicated workers are the most common type. Debugging them is relatively straightforward and integrated into the main DevTools window.
First, you need to locate the worker's script file in the Sources panel. It won't be in the same folder as your main application scripts. Instead, Chrome lists it at the top level of the source tree.
Let's look at an article that explains this.
Understanding and Using Web Workers
This article from CODE Magazine clearly shows where to find your worker scripts in DevTools.
Please read the two short sections titled "Debugging" (the first one is after the 'Signaling Completion' heading, the second is after the next code block). Focus on where the article says to find the my-first-worker.js file in the source tree.
The key is that the worker script appears as a sibling to your application's host, not nested within its script folders.
Once you find the script, you can set breakpoints just as you would for any other JavaScript file. A more powerful way to manage worker debugging is through the Threads pane in the Sources panel.
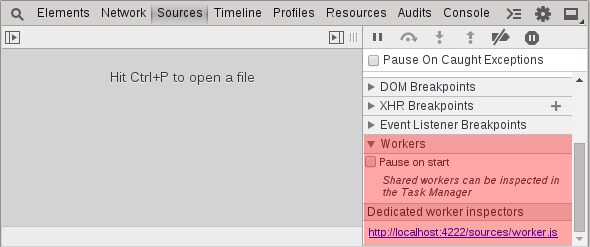
This pane is crucial because it visually represents the different execution contexts. You'll see your 'Main' thread and a separate entry for each active worker. The animated image below provides a perfect demonstration of debugging a worker in action, including how to step from the main thread into the worker's context.

Debugging Shared Workers
Shared workers can be accessed by multiple browser tabs or windows from the same origin. Because of this shared nature, their debugging process is different. You won't find them in the Sources panel of a specific tab's DevTools.
Instead, you need a central place to view all active shared workers.
Understanding and Using Web Workers
The same article we just reviewed explains the unique process for debugging Shared Workers.
Now, please read the next "Debugging" section in the article, which appears just below the 'Shared Web Workers' heading. It explains how to use a special chrome:// page.
As you read, the process is:
- Open a new tab and navigate to
chrome://inspect. - Click on the Shared Workers link in the left-hand menu.
- You'll see a list of running shared workers for all open tabs.
- Click the
inspectlink for the worker you want to debug. This will open a dedicated DevTools window just for that worker, where you can use the Console, set breakpoints in the Sources panel, and so on.
Part 2: Debugging Service Workers
Service workers are a more powerful type of worker that can intercept network requests, manage a cache, and enable features like push notifications and background sync. Their complex lifecycle can make them particularly tricky to debug.
The Service Worker Lifecycle and the Application Panel
A service worker progresses through several states: installing, installed (waiting), and activating / activated. This lifecycle is often the source of confusion, for example, when your code changes don't seem to apply immediately.
Your primary tool for managing and debugging service workers is the Application panel in DevTools.
The following video from the Chrome for Developers team is an excellent guide to the fundamentals of service worker debugging.
Debugging Service Workers in Chrome - Progressive Web App Training
This video provides a comprehensive walkthrough of the tools available in the Application panel for service workers.
Please watch from the beginning until 03:31. The video will cover: How to find your service worker in the Application panel. The meaning of its status (e.g., 'activated and is running'). How to handle updates using 'Update on reload' and 'skip waiting'.
Key takeaways from the video:
- The
Application>Service WorkersTab: This is your command center. It shows the current status of your service worker, which clients it's controlling, and provides controls to manage it. Update on reload: This is your best friend during development. Checking this box forces the browser to fetch a new version of your service worker on every page load, bypassing the default caching behavior.skip waiting: When a new service worker is installed but an old one is still active, the new one enters a "waiting" state. Theskip waitingbutton in DevTools allows you to immediately promote the new worker to the active state.
Setting Breakpoints in a Service Worker
Just like other workers, a service worker has its own execution context and a dedicated DevTools instance.
Debugging Service Workers in Chrome - Progressive Web App Training
The same video also demonstrates how to pause and inspect a service worker's code.
Now, please watch from 06:53 to 07:50. This segment shows you how to open the dedicated DevTools for a service worker and set breakpoints.
To summarize, you can:
- Click the
inspectlink next to your service worker's script in theApplicationpanel to open its dedicated DevTools. - Add a
debugger;statement in your service worker code to automatically pause execution when that line is hit. - Set breakpoints directly in the
Sourcespanel of the service worker's dedicated DevTools window, just as you would with any other script.
Essential Service Worker Debugging Tools
The Application panel provides a few more indispensable tools for solving common problems:
- Offline Checkbox: Simulates being completely disconnected from the network. This is essential for testing your caching strategies and offline fallbacks.
- Bypass for network: When this is checked, any
fetchrequests from your page will bypass the service worker and go directly to the network. This is extremely useful for isolating whether a bug is in your service worker'sfetchhandler or somewhere else. - Push: Allows you to send a mock push event directly to your service worker to test your push notification logic without needing a server.
Test your understanding!
You've just pushed an update to your Progressive Web App's service worker to fix a critical bug in your caching logic. However, a user reports that they are still experiencing the old, buggy behavior. They have reloaded the page multiple times.
What is the most likely cause of this issue, and what two actions could you guide the user to take in their DevTools Application panel to resolve it immediately?
Show answer
The most likely cause is that the new service worker has been downloaded and is in the waiting state, while the old, buggy service worker is still active and controlling the page. The browser won't activate the new worker until all tabs controlled by the old one are closed.
You could guide the user to:
- Open DevTools to the Application > Service Workers tab.
- Verify that a new worker is "waiting to activate".
- Click the
skip waitinglink next to the waiting worker. This will force the new worker to become active and take control of the page. - As an alternative, you could also have them click the
Unregisterlink for the service worker and then reload the page, which would force a fresh registration of the new version.
Conclusion
Congratulations on completing the "Advanced Debugging Techniques" module! You are now equipped to debug code not just on the main thread, but also in the powerful, isolated contexts of web workers and service workers.
Key takeaways from this lesson:
- Workers run in separate threads, each requiring its own debugging approach.
- Dedicated Web Workers can be debugged directly from the Sources > Threads panel of the main DevTools window.
- Shared Web Workers must be debugged by navigating to
chrome://inspect/#workersand opening their dedicated inspector. - Service Workers are managed from the Application panel. Understanding their lifecycle is key to effective debugging.
- Use tools like
Update on reloadandBypass for networkin theApplicationpanel to streamline your development workflow and avoid common "gotchas" with caching and updates.
In our next lesson, we will begin a new module: Performance Profiling and Optimization. Having mastered how to find and fix bugs, we will now shift our focus to identifying and resolving performance bottlenecks. Our first topic will be using the Performance Monitor to get a real-time pulse on your app's health, a perfect transition from discussing background threads that help improve performance.