Recommended resources
The freely available resources this lesson will direct you to.
Hello! Welcome to our final lesson in the "Advanced Debugging Techniques" module.
In our previous lessons, we've explored how to pause and inspect code using a variety of breakpoints and how to debug code running in separate contexts like web workers. Today, we'll cover a powerful feature that shifts from inspecting code to actively modifying it on the fly: Local Overrides.
As a lead developer, you've likely encountered situations where you need to test a quick fix on a production site, prototype a change without a full build/deploy cycle, or work on a project where the local setup is cumbersome. The Overrides feature is your solution. It allows you to save a local copy of a website's files (HTML, CSS, JS, API responses) and have Chrome serve your local version instead of the one from the network. This creates an incredibly fast feedback loop for debugging and experimentation.
By the end of this lesson, you will be able to use the Overrides feature to persist local changes to production code, enabling rapid debugging and prototyping.
Part 1: Setting Up and Overriding Source Files
The core principle of Local Overrides is simple: when enabled, DevTools intercepts network requests for specific resources and serves a file from your local disk instead. Your changes persist across page reloads, unlike temporary edits made in the Elements panel.
The following video provides an excellent walkthrough of what Overrides are for and how to get them set up.
Local Overrides in Chrome Dev Tools
This video from Drew Conley explains the motivation behind using overrides and demonstrates the initial setup process.
Please watch from the beginning until 02:28. Pay attention to the use cases mentioned and the two main steps for setup: selecting a folder and granting permissions.
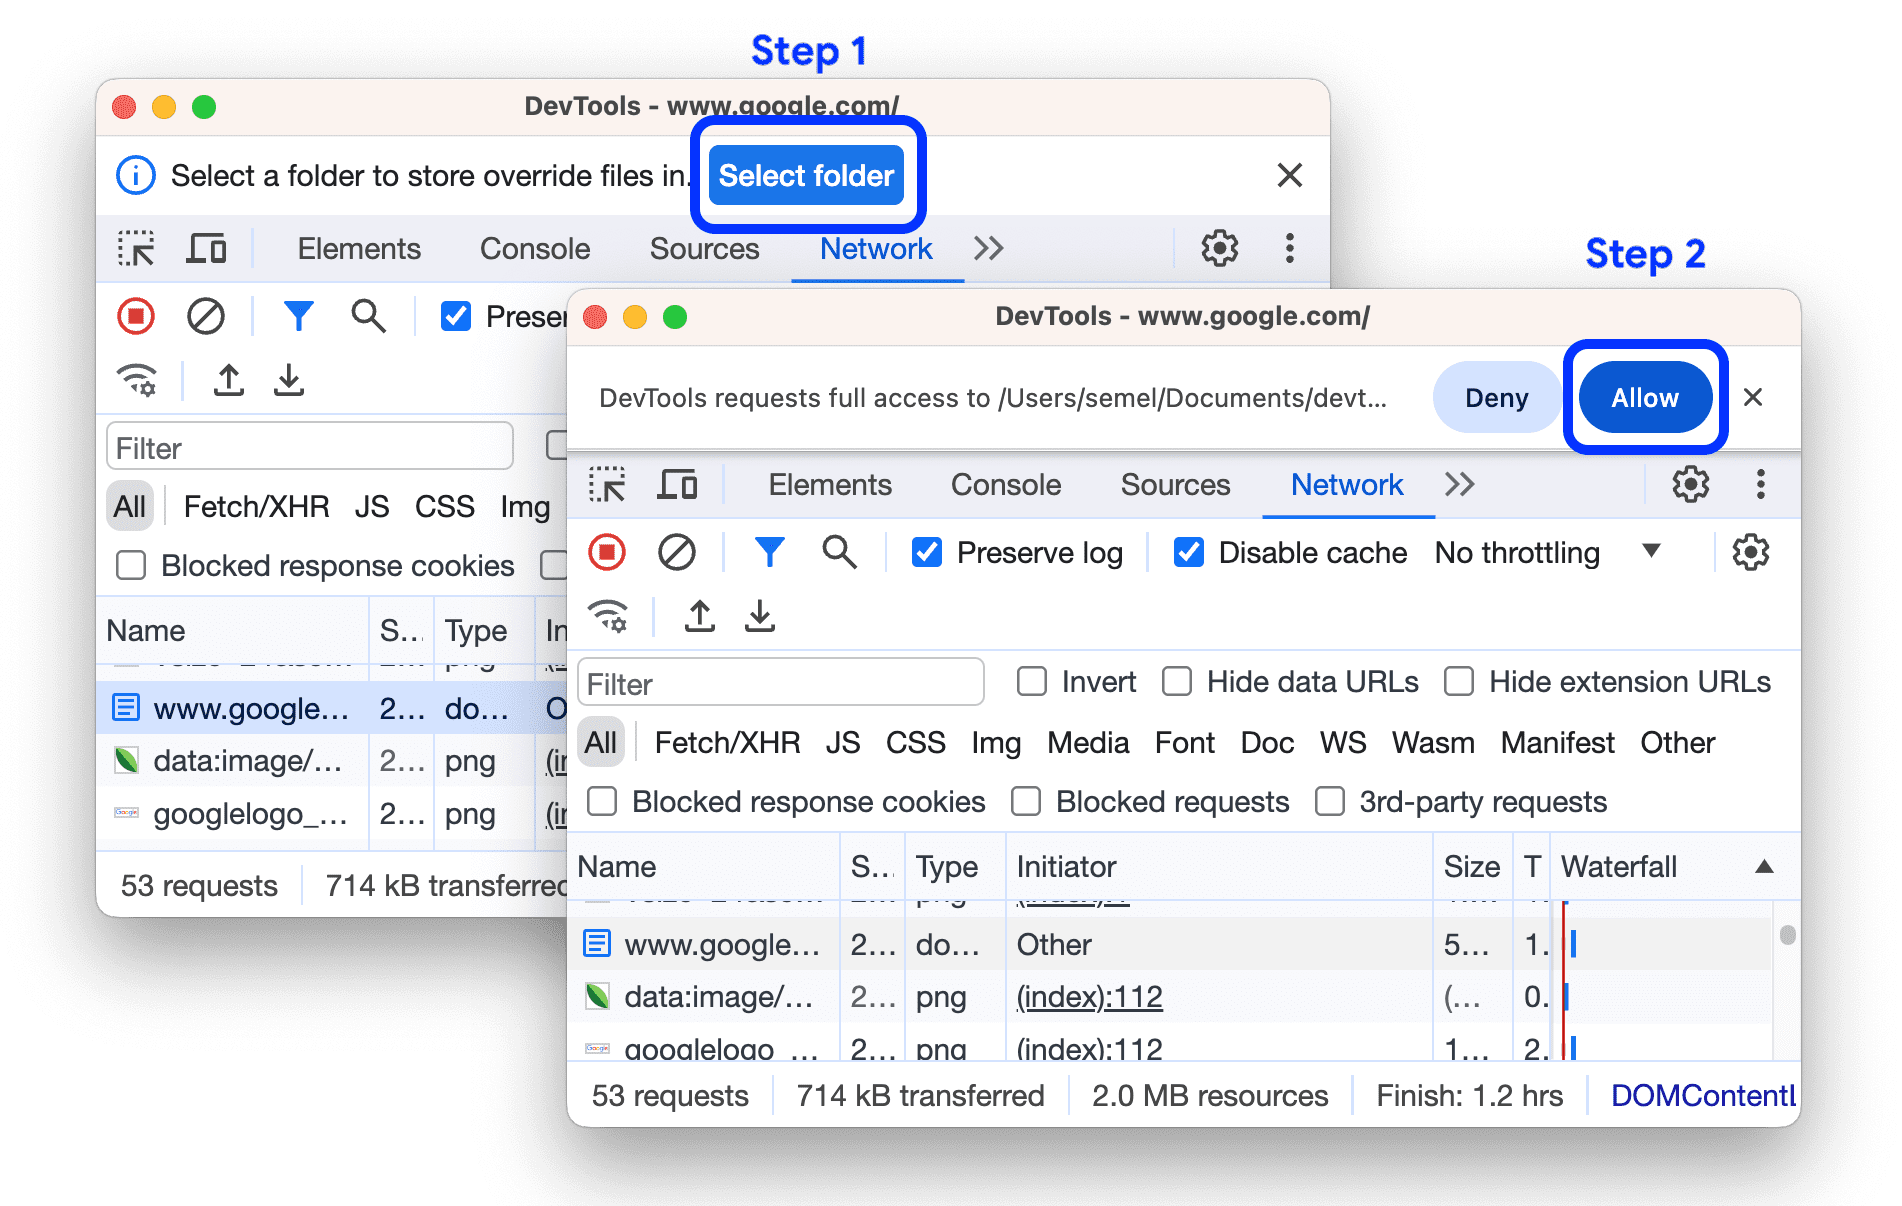
To summarize the setup process:
- Open DevTools and go to the Sources panel.
- In the left-hand pane, select the Overrides tab.
- Click + Select folder for overrides.
- Choose a local folder where you want to store your modified files.
- At the prompt at the top of the viewport, click Allow to grant DevTools permission to write to this folder.
- Ensure the Enable Local Overrides checkbox is checked.
Once set up, you can start overriding files. You can do this from almost any panel where a file is listed, but the Network panel is a common starting point. Simply right-click a resource (like a CSS or JS file) and select Override content. DevTools will save a copy to your overrides folder and open it in the Sources panel for editing.
Now, let's see this in action for HTML, CSS, and JavaScript files.
Local Overrides in Chrome Dev Tools
The same video continues by showing how to override and edit different types of files.
Please watch from 02:28 to 07:51. The video will demonstrate: Overriding an HTML document to test structural changes. Modifying a CSS file, including how to un-minify it using the {} pretty-print button. Changing JavaScript behavior and even using breakpoints in the overridden file.
Key takeaways from the demonstration:
- Persistent Changes: Any edits you save to an overridden file are immediately applied on the next page load.
- Visual Indicators: Overridden files are marked with a purple dot icon in the
Sources,Network, andElementspanels, so you always know when a local file is being used. - Debugging: You can place breakpoints and
debugger;statements in your overridden JavaScript files, seamlessly integrating this feature with the debugging workflows we've already learned.
Part 2: Mocking API Responses and Overriding Headers
Overrides are not limited to static assets. One of their most powerful applications is intercepting and modifying network requests, such as API calls (XHR/fetch) and their HTTP headers. This allows you to prototype front-end features without waiting for backend changes or to debug tricky CORS or security policy issues.
Mocking API Responses
Imagine you're building a new UI component that relies on an API endpoint that isn't finished yet. With overrides, you can mock the expected JSON response and build your component against it.
Override and mock network responses #DevToolsTips
This video from the official Chrome for Developers team shows how to override a fetch request to fix a data issue and mock an API for prototyping.
Please watch from 00:59 to 02:16. You'll see how to find an API call in the Network panel, override its content, and edit the JSON response directly in the Sources panel.
This workflow is invaluable for front-end development, as it decouples you from the backend development schedule. You can even mock error responses or different data structures to test how your UI handles various scenarios.
Overriding HTTP Response Headers
Sometimes a bug isn't in the content of a file but in the HTTP headers sent with it. A common example is a misconfigured Access-Control-Allow-Origin header causing CORS errors. Overrides let you experiment with header changes directly in the browser.
Override and mock network responses #DevToolsTips
The same video also provides a clear tutorial on overriding response headers to solve a CORS issue.
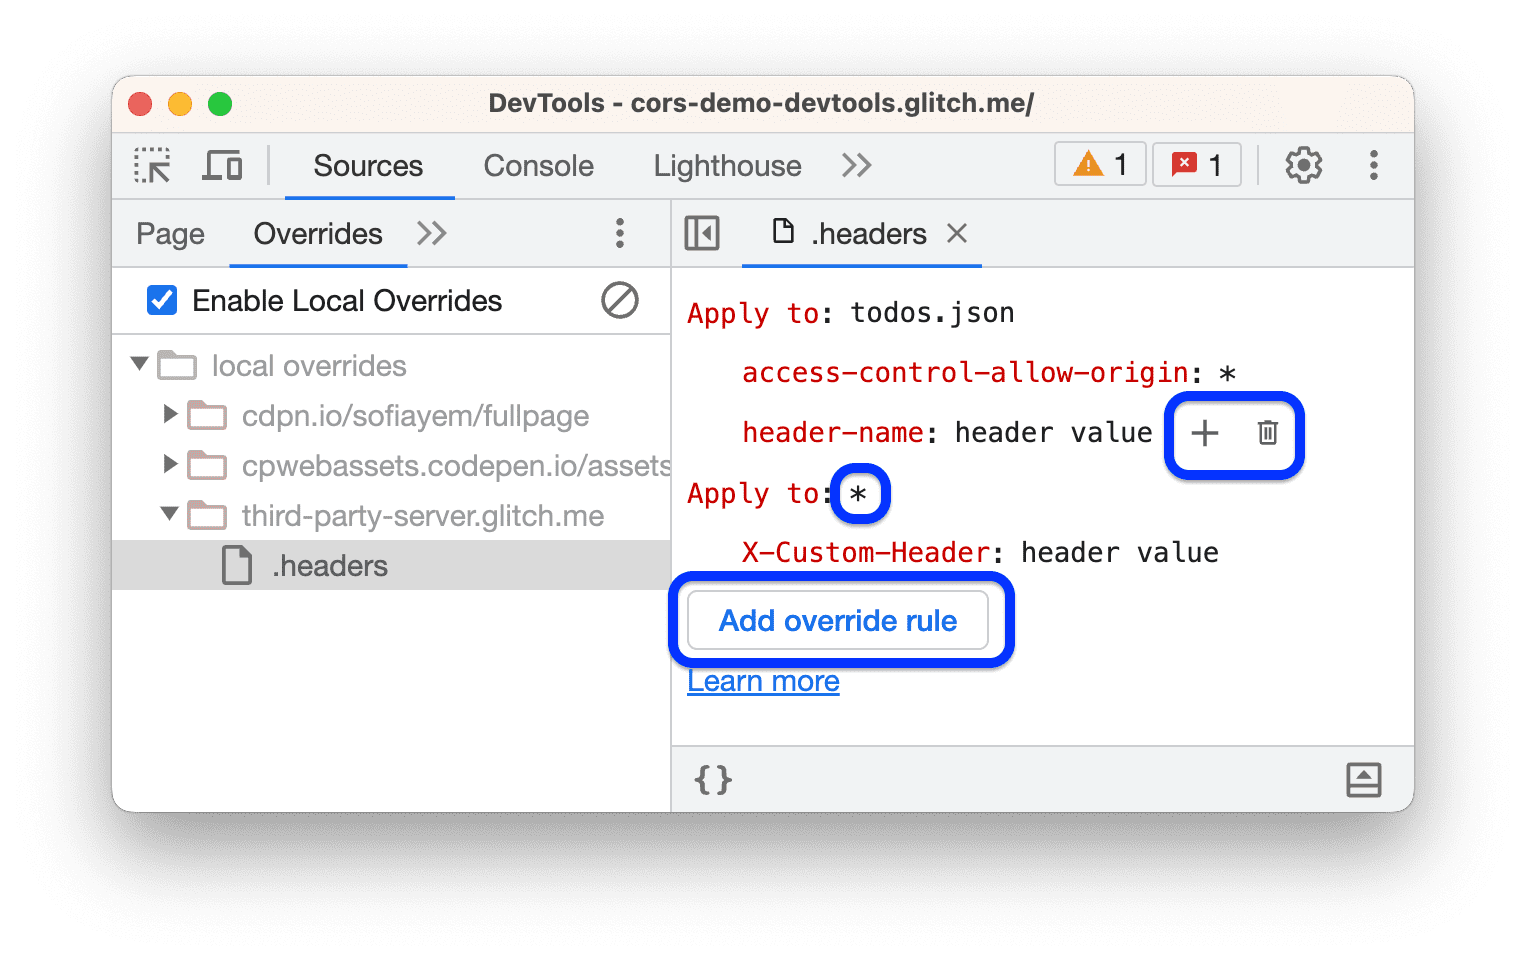
Please watch from 04:58 to 06:21. This section demonstrates how to: Use the Override headers option. Edit headers directly in the Network panel. Use the .headers file to apply overrides to multiple URLs using wildcards (*).
This is a powerful technique for debugging complex network interactions. The ability to edit the special .headers file allows you to create sophisticated rules that apply to multiple requests, which is much more efficient than overriding headers one by one.
Test your understanding!
You are tasked with building a new feature on your single-page application. The backend team has provided you with a JSON schema for a new API endpoint (/api/v2/new-feature), but the endpoint itself is not yet live (it returns a 404 error).
How would you use Local Overrides to proceed with front-end development without being blocked? Describe the steps you would take.
Show answer
- Enable Overrides: Go to the Sources > Overrides tab, select a local folder, and ensure "Enable Local Overrides" is checked.
- Trigger the Request: Navigate through your application to trigger the
fetchcall to/api/v2/new-feature. - Find the Failed Request: In the Network panel, find the failed (404) request for
new-feature. - Override Content: Right-click the request and select Override content. DevTools will create an empty file in your overrides folder and open it in the
Sourcespanel. - Mock the Response: Paste or write the mock JSON data (based on the schema from the backend team) into this new file.
- Save and Reload: Save the file (
Ctrl+SorCmd+S) and reload the application page. Now, when your code makes the samefetchcall, DevTools will intercept it and serve your local mock JSON with a 200 status, allowing you to build and test your UI as if the API were live.
Part 3: Managing Overrides and Best Practices
While extremely powerful, overrides can cause confusion if you forget they are active.
- Disabling Overrides: To return to the live versions of all files, simply go to Sources > Overrides and uncheck the Enable Local Overrides checkbox. Reload the page, and all overrides will be disabled.
- Clearing Overrides: To permanently delete your override files, you can right-click a file or folder in the Sources > Overrides tab and select Delete.
- Finding Overrides: The Sources > Overrides tab is the central place to see all your active overrides. You can also filter for
is:overriddenin the Network panel to see only requests that were served from your local overrides. - Limitations: Remember that DevTools disables the browser cache when overrides are enabled. Also, changes made in the DOM tree of the
Elementspanel will still be lost on reload; overrides work by replacing the network resource, not by persisting DOM changes.
For a comprehensive reference on everything we've covered, the official documentation is an excellent resource to bookmark.
Override web content and HTTP response headers locally
The official Chrome documentation provides a complete, text-based reference for Local Overrides. It's a great place to review the concepts and find details on specific features.
Skim through this document. You don't need to read it word-for-word, as we've covered the main points. Just familiarize yourself with its structure so you know where to look if you need to reference something in the future. Pay special attention to the 'Limitations' section.
Conclusion
This lesson concludes our module on "Advanced Debugging Techniques." You've mastered a powerful set of tools, from conditional breakpoints and async stack traces to debugging workers and now, modifying live code with Local Overrides.
Key Takeaways:
- Local Overrides let you substitute network resources with local files, which persist across page reloads.
- This is invaluable for rapid prototyping and debugging, especially on production systems or projects with slow build cycles.
- You can override any web content (HTML, CSS, JS) and even mock API responses and HTTP response headers.
- Always remember to manage your overrides by disabling or clearing them when you're finished to avoid confusion.
In our next lesson, we will begin the "Performance Profiling and Optimization" module. Having learned how to find and fix functional bugs, we will now turn our attention to identifying and resolving performance bottlenecks. Our first topic will be the Performance Monitor, a tool that gives you a real-time overview of your app's health, providing a perfect bridge from debugging to performance analysis.