Recommended resources
The freely available resources this lesson will direct you to.
Hello! Welcome to your next lesson on advanced performance metrics.
In our last session, we refined our understanding of annualized returns by introducing the Modified Internal Rate of Return (MIRR). We saw how MIRR provides a more realistic return figure than IRR by using an explicit reinvestment rate. However, both IRR and MIRR are percentage-based metrics. They tell you about the efficiency of an investment, but not its magnitude. A small, highly efficient project might not be better than a large, slightly less efficient one.
Today, we'll address this by focusing on a metric that helps compare apples and oranges. The learning outcome for this lesson is to calculate the profitability index for comparing investment opportunities of different scales. The Profitability Index (PI) is a simple but powerful ratio that helps you determine the "bang for your buck," making it an indispensable tool when you have a limited budget.
1. The Challenge of Capital Rationing
In an ideal world, you would accept every real estate project with a positive Net Present Value (NPV). A positive NPV means the project is expected to create value. However, in reality, investment capital is almost always limited. This problem is known as capital rationing.
Imagine you have a budget of €500,000. You evaluate three potential properties:
| Project | Initial Investment | NPV |
|---|---|---|
| Property A | €450,000 | €100,000 |
| Property B | €300,000 | €80,000 |
| Property C | €200,000 | €65,000 |
If you simply choose the project with the highest NPV, you'd select Property A and use €450,000 of your budget to generate €100,000 in value. You wouldn't have enough capital left for any other project.
But what if you chose the other two? Investing in both Property B and Property C would require €300,000 + €200,000 = €500,000. The total NPV for this combination would be €80,000 + €65,000 = €145,000.
By choosing the two smaller projects, you use your entire budget to generate significantly more value (€145k vs. €100k). This is precisely the kind of decision the Profitability Index is designed to clarify.
Net Present Value (NPV): What You Should Know
The article 'Net Present Value (NPV): What You Should Know' from PropertyMetrics provides an excellent introduction to this exact problem.
Please read the section titled 'NPV Decision Rule'. Focus on the example provided under the paragraph discussing limited capital. This will solidify your understanding of why simply relying on NPV isn't always optimal.
2. Defining and Calculating the Profitability Index (PI)
The Profitability Index (also known as the Benefit-Cost Ratio) measures the value created for each unit of currency invested. It's a relative measure of profitability.
The primary formula for PI is:
Since we know that NPV is calculated as (Present Value of Future Cash Flows) - Initial Investment, we can derive a very useful alternative formula:
This second formula is particularly intuitive: it shows that the PI is a baseline of 1 (your initial investment returned) plus the NPV generated per euro invested.
The following video provides a clear, step-by-step guide on how the PI calculation builds on concepts like NPV.
The video 'Profitability index' from The Finance Storyteller does a great job of explaining what PI is and how to calculate it from scratch.
Watch the sections from 0:00-0:59, 1:52-2:50, and 3:56-4:38. Focus on how PI incorporates the time value of money (like NPV) and the initial investment cost (like ROI) to create a comprehensive ratio.
Interpreting the PI
The decision rule for PI is straightforward:
- PI > 1.0: The project's present value of inflows exceeds the initial investment. It creates value (NPV > 0). Accept.
- PI = 1.0: The project breaks even in present value terms (NPV = 0). Indifferent.
- PI < 1.0: The project's costs outweigh its benefits in present value terms (NPV < 0). Reject.
3. Using PI to Rank Projects
Now, let's revisit our capital rationing problem and see how PI helps us make the right choice.
| Project | Initial Investment | NPV | PI Calculation (1 + NPV/Investment) | PI Value | Rank |
|---|---|---|---|---|---|
| Property A | €450,000 | €100,000 | 1 + (100k / 450k) | 1.22 | 3 |
| Property B | €300,000 | €80,000 | 1 + (80k / 300k) | 1.27 | 1 |
| Property C | €200,000 | €65,000 | 1 + (65k / 200k) | 1.26 | 2 |
By ranking the projects by their PI, we prioritize those that give us the most value per euro invested. The ranking is B > C > A. With our €500,000 budget, we would select Property B (€300k) first. We then have €200,000 remaining, which is exactly enough for Property C. This confirms our earlier conclusion that investing in B and C is the optimal choice.
This ability to compare projects of different sizes is the key strength of the Profitability Index.
What Is Profitability Index and How to Use It for Investments
The article 'What Is Profitability Index and How to Use It for Investments' from ROK Finance further explains why this metric is so important for practical decision-making.
Read the section 'Why Does Profitability Index Matter in Investment Decisions?'. Pay close attention to the subsections 'Helps Prioritize Projects Under Budget Constraints' and 'Offers a More Scalable Comparison Than NPV'.
4. Real Estate Example in Python
Let's apply this to a concrete real estate scenario. You are evaluating two apartments in Spain and have a discount rate of 8%.
Apartment 1: Small Studio in Valencia
- Initial Investment: €120,000
- Projected Net Cash Flows (Years 1-5): €10,000 per year
- Projected Net Sale Price (End of Year 5): €140,000
Apartment 2: Two-Bedroom Flat in Madrid
- Initial Investment: €300,000
- Projected Net Cash Flows (Years 1-5): €20,000 per year
- Projected Net Sale Price (End of Year 5): €350,000
Here's the Python code to calculate the NPV and PI for both. Notice we calculate the present value of future inflows first, then use that to find both NPV and PI.
import numpy as np

def calculate_investment_metrics(initial_investment, cash_flows, sale_price, discount_rate, term):
    """Calculates PV of inflows, NPV, and PI for a real estate investment."""

    # Combine the final year's cash flow with the sale price
    full_cash_flows = list(cash_flows)
    full_cash_flows[-1] += sale_price

    # Calculate the Present Value of all future cash inflows
    pv_inflows = 0
    for t in range(1, term + 1):
        pv_inflows += full_cash_flows[t-1] / ((1 + discount_rate) ** t)

    # Calculate NPV
    npv = pv_inflows - initial_investment

    # Calculate Profitability Index
    # Use abs() on initial_investment to handle it as a positive number in the denominator
    pi = pv_inflows / abs(initial_investment)

    return pv_inflows, npv, pi

# --- Investment Data ---
discount_rate = 0.08

# Apartment 1: Valencia Studio
inv1 = 120000
cf1 = [10000] * 5
sale1 = 140000

# Apartment 2: Madrid Flat
inv2 = 300000
cf2 = [20000] * 5
sale2 = 350000

# --- Calculations ---
pv_inflows1, npv1, pi1 = calculate_investment_metrics(inv1, cf1, sale1, discount_rate, 5)
pv_inflows2, npv2, pi2 = calculate_investment_metrics(inv2, cf2, sale2, discount_rate, 5)

# --- Results ---
print("--- Apartment 1: Valencia Studio ---")
print(f"Initial Investment: €{inv1:,.0f}")
print(f"PV of Future Inflows: €{pv_inflows1:,.2f}")
print(f"NPV: €{npv1:,.2f}")
print(f"Profitability Index (PI): {pi1:.2f}\n")

print("--- Apartment 2: Madrid Flat ---")
print(f"Initial Investment: €{inv2:,.0f}")
print(f"PV of Future Inflows: €{pv_inflows2:,.2f}")
print(f"NPV: €{npv2:,.2f}")
print(f"Profitability Index (PI): {pi2:.2f}")
Expected Output:
--- Apartment 1: Valencia Studio ---
Initial Investment: €120,000
PV of Future Inflows: €135,229.46
NPV: €15,229.46
Profitability Index (PI): 1.13

--- Apartment 2: Madrid Flat ---
Initial Investment: €300,000
PV of Future Inflows: €317,804.14
NPV: €17,804.14
Profitability Index (PI): 1.06
The Madrid flat has a higher absolute NPV (€17.8k vs €15.2k), but the Valencia studio has a higher PI (1.13 vs 1.06). If you were constrained by capital, the PI suggests the Valencia property is the more efficient use of your funds, generating €0.13 of value for every euro invested, compared to €0.06 for the Madrid property.
The image below shows another example of calculating PI in Python for multiple projects, reinforcing the concept.

Test your understanding!
You have a total of €250,000 to invest. Your required rate of return (discount rate) is 7%. You are evaluating three projects:
- Project X: Initial Investment: €250,000. NPV: €40,000.
- Project Y: Initial Investment: €150,000. NPV: €30,000.
- Project Z: Initial Investment: €100,000. NPV: €22,000.
Which project or combination of projects should you choose to maximize the value from your €250,000 budget? Use the Profitability Index to justify your answer.
Show answer
First, let's calculate the PI for each project:
- PI for X: 1 + (€40,000 / €250,000) = 1.16
- PI for Y: 1 + (€30,000 / €150,000) = 1.20
- PI for Z: 1 + (€22,000 / €100,000) = 1.22
Now, rank them by PI: Z > Y > X.
Following this ranking:
- Choose Project Z (PI = 1.22). Cost = €100,000. Budget remaining = €150,000.
- Choose Project Y (PI = 1.20). Cost = €150,000. Budget remaining = €0.
The optimal choice is to invest in Projects Y and Z. This uses the full €250,000 budget and generates a total NPV of €30,000 + €22,000 = €52,000.
If you had chosen only Project X (the one with the highest individual NPV), you would have generated only €40,000 in value.
Conclusion
We've now added another crucial tool to your analytical toolkit. The Profitability Index bridges the gap between the absolute value creation of NPV and the relative efficiency of percentage-based returns like MIRR.
Key Takeaways:
- Profitability Index (PI) measures the present value of future returns for every euro invested.
- The primary formula is
PI = PV of Future Cash Flows / Initial Investment. An alternative isPI = 1 + (NPV / Initial Investment). - A PI greater than 1.0 indicates a value-creating investment.
- PI's main strength is in ranking projects of different sizes, especially when capital is limited (capital rationing), to ensure you allocate funds to the most efficient opportunities.
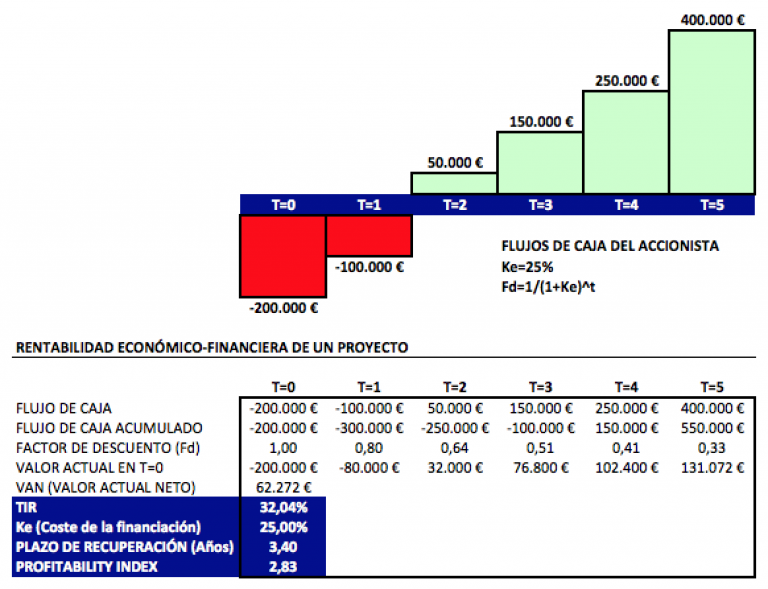
As a final note, the concept of PI is universal in finance. The image below, taken from a Spanish financial analysis site, shows the "Índice de Rentabilidad," confirming its use in the Spanish market.
Preview of the Next Lesson:
So far, our advanced metrics have focused on refining our measurement of returns (MIRR) and efficiency (PI). But every projection of future cash flow carries uncertainty. In our next lesson, we will begin to quantify this uncertainty by learning how to calculate the standard deviation of projected returns to quantify investment volatility. This will be our first step into the critical world of risk measurement.