Recommended resources
The freely available resources this lesson will direct you to.

Hello. In the previous lesson, you framed an address-exception assistant precisely: it prepares a sourced discrepancy note and a customer clarification draft, while a coordinator checks both before any message is sent or order record is changed. That tells us what work would change. It does not yet tell us what business result should change, or why.
This lesson develops a causal value hypothesis: a testable account of how an AI intervention could improve an operational or financial KPI. The aim is not to promise a return. It is to make the proposed route to value clear enough that someone could measure it—and discover if it is wrong.
Start with the business result, but do not skip the middle
“AI will make address exceptions faster” sounds plausible. It leaves out the part a decision-maker most needs to understand: faster at what, and how does that improvement reach a business result?
Watch Gartner’s discussion of AI applied to an existing workflow. Focus on the speaker’s demand for evidence behind a claimed change in cycle time, rather than on the label “ROI.”
The 3 AI Business Outcomes That Matter: ROI, ROE, ROF
Watch “The 3 AI Business Outcomes That Matter: ROI, ROE, ROF” from Gartner for its account of value in an established business process.
In the ROI approach, notice the distinction between introducing AI into a familiar workflow and demonstrating a change in its existing business indicators.
For the address-exception assistant, the proposed causal story has several links. The tool must produce a usable note and draft. Coordinators must use them. Reading, drafting, and editing must then take less total time than the current method, including the time spent checking the AI’s work. If those minutes are saved across eligible exceptions without creating more errors, an operational KPI—such as coordinator handling time per exception—could improve.
Each link could fail. A fluent draft might misstate the conflicting suite numbers and require extensive correction. A useful draft might arrive too late in the workflow to save time. Handling time might fall, but only because staff send vague questions that trigger a second round of clarification. A causal value hypothesis keeps these possibilities visible; a claim that the technology is “productive” does not.
Trace an intervention to a KPI
A useful way to organize the story is to distinguish the business objective from the measures closer to the system. Read Amazon Web Services’ “Demonstrating business value” section in Architecting a successful generative AI proof of concept. Its Objectives, Goals, Strategies, and Measures framework provides a vocabulary for connecting them.
Architecting a successful generative AI proof of concept
Read the “Demonstrating business value” section from Amazon Web Services to see how a business objective can be traced to measurable results and system-level measures.
Under “Demonstrating business value,” read the opening explanation and framework. Stop after the four definitions of Objectives, Goals, Strategies, and Measures; you do not need the example table for this lesson. As you read, distinguish a measure of whether an AI output is usable from a measure of whether the business task improves.
In our example, the objective might be to process address exceptions efficiently without compromising accuracy. The intervention is the assistant’s sourced note and clarification draft, presented at the point where a coordinator reviews a flagged conflict. A near-term measure is whether coordinators can use the drafts after review. The operational KPI is the average active coordinator handling time per eligible exception.
Those measures are related, but not interchangeable. A high-quality draft is evidence that the tool can help. Frequent use is evidence that it is reaching the workflow. Neither proves that the coordinator’s total handling time falls. Conversely, a shorter handling time is not a success if incorrect address details lead to more corrective work.
It helps to state the mechanism in ordinary language before choosing a target number:
By identifying the two conflicting address details and drafting a question that does not presume which is correct, the assistant may remove some manual comparison and writing time. The coordinator’s source check and edits add time back. The expected net effect is less active handling time per eligible exception, provided the draft does not increase errors or follow-up work.
That is more informative than “the model drafts messages, so productivity rises.” It identifies both the work removed and the work introduced.
Make the claim measurable—and capable of being disproved
A KPI needs a unit, a population, a comparison, and a time window. Suppose, purely as an illustrative baseline, coordinators currently spend an average of 18 active minutes on each eligible flagged address exception through the first approved clarification. A proposed target might be 14 minutes after eight weeks of use.
Define “active minutes” consistently. For the assisted workflow, they include opening the exception, inspecting the note against its sources, editing or rejecting the draft, and completing the normal approval step. They should not exclude review simply because AI produced the first version. Measure the KPI across all eligible exceptions, including cases where a coordinator chooses not to use the draft; otherwise, reporting only the easiest assisted cases could create an apparent improvement.
The choice of handling time also matters. A coordinator may draft a clarification faster while the customer takes just as long to reply. In that situation, staff effort has fallen, but end-to-end order resolution time has not necessarily changed. If the business objective is earlier order release, that broader measure needs its own evidence. Do not claim it on the strength of drafting speed alone.
Alongside the primary KPI, track measures that test the explanation and protect against a misleading result:
| Role in the hypothesis | Example measure | What it tells you |
|---|---|---|
| Adoption | Share of eligible exceptions for which the coordinator uses an AI draft | Whether the intervention is entering the workflow |
| Mechanism | Active review and editing time on assisted cases | Whether checking the draft consumes the time it was meant to save |
| Primary operational KPI | Mean active handling minutes across all eligible exceptions | Whether the task improves in practice |
| Quality guardrail | Rate of clarification messages with incorrect or unsupported address details, plus avoidable follow-up | Whether speed is being purchased at the expense of accuracy |
A baseline should cover comparable exceptions handled under the current process, not just a single memorable case. Keep the definition of an “eligible flagged exception” stable. If case complexity or incoming volume changes, a before-and-after difference may reflect those changes rather than the assistant. A comparable group continuing with the current process, if available, makes the causal claim stronger. This lesson does not require a full pilot design; the point is to avoid treating any observed improvement as proof that AI caused it.
Separate an operational gain from a financial claim
Reduced handling time can be valuable without immediately reducing expenditure. Staff might use freed capacity to clear a backlog, handle rising volume, or spend more time on complex exceptions. Those are potential productivity or service benefits. Calling the saved minutes “cash savings” requires another link: for example, paid overtime actually falls, or an otherwise necessary staffing expense is avoided.
The UK government’s Digital and Data Benefits framework gives a useful structure for thinking from affected roles and tasks toward potential value. Its human-error example also shows why avoided rework can be a separate benefit—but only when errors really decline.
Digital and Data Benefits framework - GOV.UK
Read the benefits-quantification section of the UK government’s “Digital and Data Benefits framework” for its approach to affected roles, task time, and avoidable error costs.
In Section 2.3, “Benefits quantification,” read subsection 2.3.1, “Productivity,” from the productivity discussion. Then, in the benefits table following that subsection, find the row labelled “1. Reduced human error.” Read from its example of errors in onboarding through the first calculation ending at the reprocessing-cost method. Focus on what must actually change before time saved or errors avoided can be described as a benefit.
For this use case, a defensible financial hypothesis would be conditional: if shorter handling time reduces recurring paid overtime for address exceptions, and exception volume and service quality remain comparable, overtime expenditure should fall. If managers instead reassign the available time to a backlog while payroll stays unchanged, report the capacity or service improvement; do not report a payroll saving that did not occur. Nor should faster handling and avoided rework be counted twice if the same corrective minutes are already included in handling time.
The distinction does not make the operational KPI second-rate. It makes the eventual business case honest about where value is observable and where an additional assumption is needed.
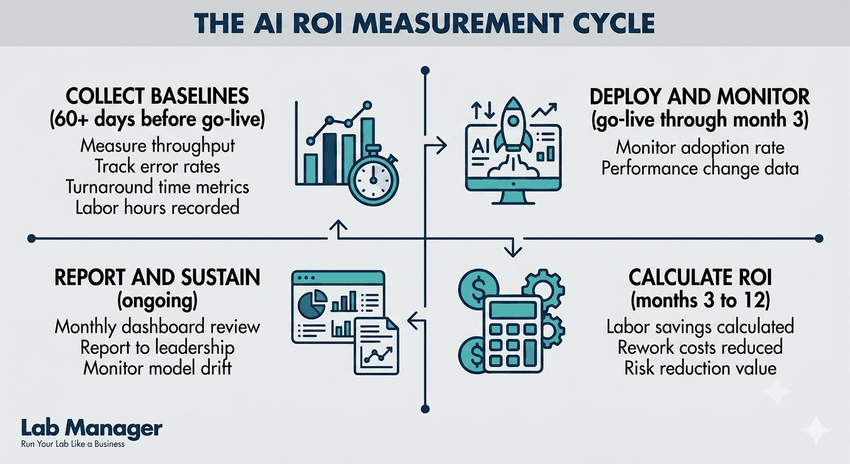
The infographic below places baseline collection before deployment and continued observation after it. Its month ranges are an example, not a required timetable for this use case. The relevant idea here is that adoption and performance must be observed after launch before a value claim is treated as realized.
Put the hypothesis in a form others can test
A complete statement can now be written without pretending that its illustrative numbers are forecasts:
For eligible flagged address exceptions, providing coordinators with a sourced discrepancy note and clarification draft, subject to their review and approval, will reduce mean active handling time through the first approved clarification from an illustrative baseline of 18 to 14 minutes per eligible case by the end of an eight-week trial, compared with a comparable current-process baseline. The proposed mechanism is that time saved on comparing sources and drafting exceeds time spent checking and editing. This claim assumes coordinators use the drafts on a substantial share of eligible cases and counts as successful only if incorrect-detail and avoidable-follow-up rates do not rise.
Notice what the statement permits you to learn. If drafts are used but handling time stays at 18 minutes, the proposed time-saving mechanism has not been demonstrated. If assisted cases are quick but most eligible cases cannot use the draft, the expected workflow-wide effect may be small. If handling time reaches 14 minutes while follow-up work rises, the claimed improvement is incomplete. These are useful findings, not inconvenient exceptions to a promise.
A causal value hypothesis is therefore a disciplined bridge between the use-case frame and a business case. It names the intervention, explains how work is expected to change, selects a KPI at the right level, establishes what it will be compared against, and states the conditions under which the result would count as value.
Key takeaways
An AI output is not itself a business outcome. Trace its use through a change in work to an operational KPI, and test whether review, low adoption, or new errors break that chain. Specify the KPI’s population and baseline so that a result can challenge the hypothesis. Treat a financial benefit as a further claim that needs its own evidence, not an automatic conversion of minutes saved into cash.
In the next lesson, you will use an explicit baseline to estimate the annual gross benefit of a use case. The causal hypothesis developed here tells you which improvement is worth estimating—and which assumptions that estimate must not hide.