Recommended resources
The freely available resources this lesson will direct you to.
Hello. This module begins with production Linux diagnostics: using measurements to distinguish a busy host from a host whose work is actually waiting for capacity. The same approach is useful whether Linux is running a service directly, hosting containers, or serving as a cloud compute node.
In this lesson, you will diagnose CPU saturation by connecting four kinds of evidence: load averages, runnable tasks, per-process and per-CPU measurements, and sampled CPU profiles. The aim is not just to find a high number. It is to explain what is competing for CPU time, whether that competition is sustained, and what the CPU is doing while it is busy. Allow about 40 minutes.
Begin with utilization and saturation
A CPU is utilized when it is doing work. It is saturated when runnable work cannot get CPU time promptly and must wait. These are related but different observations: high utilization shows that capacity is being used; a persistent queue of runnable work shows demand pressing against available capacity.
Brendan Gregg’s USE method provides a useful starting discipline: for a resource, examine utilization, saturation, and errors rather than repeatedly opening whichever tool is most familiar. For CPU diagnosis, utilization and saturation are the immediate questions. Keep the reported symptom—such as rising request latency—in view as you investigate.
Linux Performance Tools, Brendan Gregg, part 1 of 2
Watch “Linux Performance Tools, Brendan Gregg, part 1 of 2” for the reasoning behind checking utilization and saturation separately.
In the USE-method discussion, watch the framework. Focus on Gregg’s explanation that saturation creates queues and added latency; you will look for both busy CPU time and evidence of waiting in the measurements below.
Before interpreting a host-wide percentage, establish its relevant capacity. nproc reports CPUs available to the command you run; mpstat will let you inspect them individually. In a constrained container or service, the CPU capacity available to the workload may be lower than the host’s CPU count. Keep that distinction in mind rather than treating every host-wide percentage as the workload’s full picture.
Use load average as a prompt, not a verdict
Run uptime to get a quick indication of demand:
$ uptime
 10:42:00 up 12 days, load average: 6.20, 4.10, 2.30
The three values describe exponentially damped demand over roughly 1, 5, and 15 minutes. Here, recent demand is higher than earlier demand. The numbers are not CPU percentages, and Linux load includes both runnable tasks and tasks in uninterruptible sleep, often associated with I/O. On a four-CPU host, a load of six deserves investigation; it does not, by itself, prove that CPUs are saturated.
Linux Performance Tools, Brendan Gregg, part 1 of 2
Continue “Linux Performance Tools” for Gregg’s explanation of why Linux load averages require a second measurement.
In the load-average discussion, watch load interpretation. Notice both what the three time horizons reveal about a trend and why tasks blocked outside the CPU make a high load ambiguous.
The next measurement asks a more direct question: how many tasks are runnable now?
vmstat 1 6
This requests six reports one second apart. Set aside the first line when judging the current incident: it contains since-boot averages for several fields. In the subsequent interval reports, concentrate on r and the CPU columns:
| Field | What it contributes to the diagnosis |
|---|---|
r |
Tasks running or ready to run; a sustained value above available CPU capacity suggests a runnable backlog. It is not just the number waiting. |
us, sy |
CPU time spent in user code and kernel code. |
id |
Idle CPU time; substantial idle time argues against host-wide CPU saturation. |
wa |
CPU time accounted as I/O wait; it is not CPU executing I/O work. |
st |
Time a virtual machine was ready for CPU but the hypervisor did not provide it. |
b |
Tasks in uninterruptible sleep; useful context when load is high but r is low. |
Look for a pattern across intervals, not one exceptional second. On a four-CPU host, repeated r values of seven or eight alongside near-zero id support CPU saturation. A load average of eight with r near one, several blocked tasks, and appreciable wa points away from runnable CPU contention; investigate the waiting resource rather than immediately tuning CPU capacity. High st calls for a different explanation again: the virtual machine is losing CPU time outside the guest.
Linux Performance Troubleshooting Demos
Watch grobelDev’s “Linux Performance Troubleshooting Demos” to see the interval measurements on a live screen.
In the vmstat demonstration, watch runnable tasks, then CPU time. Watch per-CPU balance for the next distinction: spare CPU time on one core does not necessarily help work confined to another. Treat an elevated r as evidence to confirm across intervals, not as a verdict from one reading.
Check that balance explicitly:
mpstat -P ALL 1 5
mpstat reports the aggregate and individual CPUs. If every CPU is nearly fully busy while r remains above the available CPU count, the host-wide case is strong. If one CPU is fully busy while the others have ample idle time, investigate a hot thread or restricted CPU placement instead. The aggregate percentage alone can hide that bottleneck.
Identify the work consuming CPU
Once the host measurements establish when and where pressure occurs, identify the responsible processes. top offers a quick system and process view. For repeatable interval evidence, use pidstat:
pidstat -u 1 5
Compare a process’s %usr and %system with the host’s us and sy. A process spending much of its time in user code suggests a different investigation from one spending much of its time executing kernel code on its behalf. Process %CPU can exceed 100% on a multicore host: roughly 300% means about three CPU cores’ worth of execution, not an impossible percentage.
For a multithreaded process, inspect its threads rather than stopping at its total:
pidstat -t -p 1234 1 5
Replace 1234 with the PID under investigation. The process total may conceal one thread near a full core while other threads do little work. ps can help identify a command or parent process, but its %CPU is not the same one-second measurement as pidstat; do not compare them as though they were synchronized samples.
Read Brendan Gregg’s “Linux Performance Tools” slides for a concrete process-and-thread CPU report.
Find the slide titled “pidstat” by searching the PDF for pidstat -t 1. Read the CPU example, beginning with the description of process statistics and ending at the last displayed Java thread before the pidstat -d 1 disk-I/O example. Focus on the distinction between the process row (TGID) and thread rows (TID), and on user versus system CPU time.
There is an important blind spot: a command that starts, uses CPU, and exits between top refreshes might never appear in its process list. If host CPU remains busy but no persistent process accounts for it, do not dismiss the host evidence. A system-wide CPU profile can sample short-lived execution too.
Profile the busy code path
Process metrics answer who consumed CPU; profiling helps answer where that process spent its on-CPU time. A sampling profiler periodically records the stack currently running on a CPU. During an approved investigation window, a short system-wide capture might be:
perf record -F 99 -a -g -- sleep 15
perf report --stdio
Here, -F 99 requests 99 samples per second, -a samples across the system, and -g captures call graphs. The resulting report attributes sampled on-CPU execution to functions and their calling stacks. Use production approval and appropriate privileges: profiling has overhead, and a system-wide capture may record information about other workloads.
Return to Gregg’s slides to connect the perf commands to stack samples and flame-graph interpretation.
Find the slide titled “perf_events: CPU profiling.” Read the sampling example, from the capture command through the displayed perf report stack excerpt. Then find “perf_events: Flame Graphs” and read the axis explanation. Finally, on “perf_events: Gotchas,” read the warning. Focus on what a sample can establish—and how missing symbols or broken stacks can limit that conclusion.
A CPU flame graph groups those sampled stacks. Its vertical direction shows call-stack depth: a box sits above the function that called it. Its horizontal width represents how often that stack or function appears in samples. Horizontal position is not elapsed time, and a wide box includes samples in its descendants; it does not necessarily mean the named function’s own instructions took all that time.
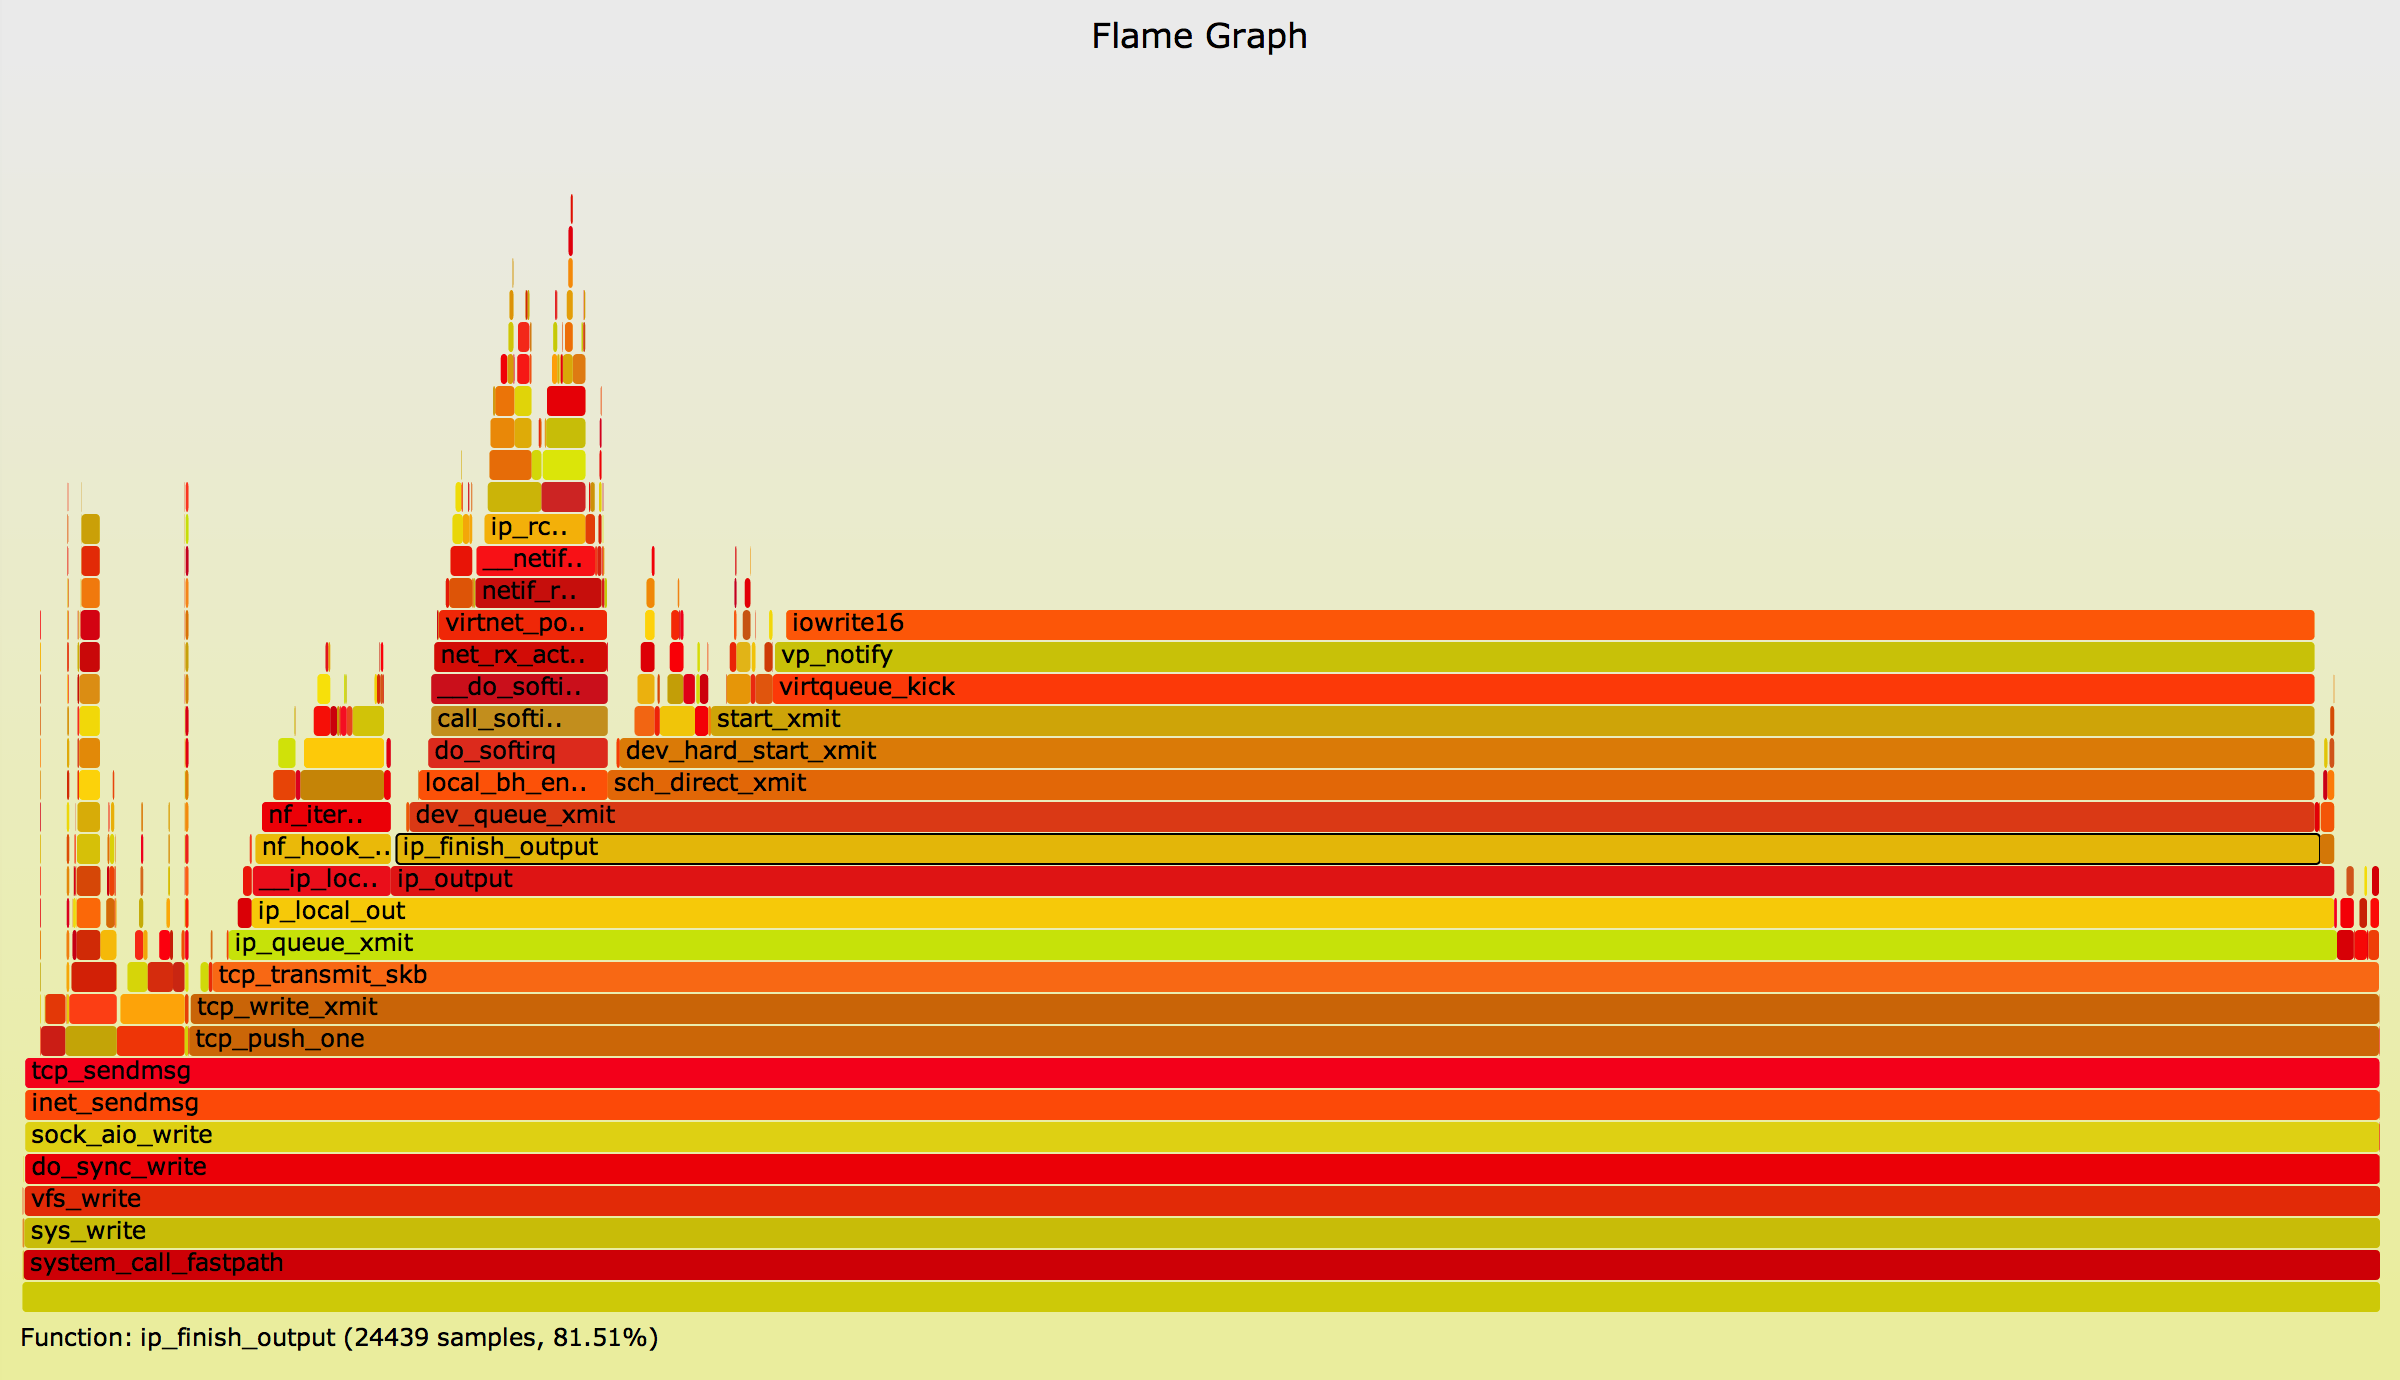
In this image, follow the lower TCP-send frames upward into ip_finish_output and its descendants. That is stronger evidence for where CPU time was observed than a generic “high system CPU” reading. It is not proof of a network fault, nor does an on-CPU profile measure how long requests waited off-CPU. Compare the profile with process metrics and the workload at the same time. If stacks or symbols are incomplete, report that limitation instead of naming a root cause from an unreadable frame.
Put the evidence together
Suppose a four-CPU host has rising service latency, a one-minute load average of seven, repeated vmstat readings with r between six and nine and id near zero, and mpstat shows all four CPUs busy. pidstat then attributes roughly three cores’ worth of CPU to one service, mostly in user time. Those observations support host-wide CPU saturation with that service as the principal consumer. A profile can narrow the explanation to the code paths active during the incident; it cannot, on its own, tell you why demand increased.
Change two observations and the conclusion changes. If r stays low while blocked tasks and I/O wait are high, load average no longer supports a CPU-saturation claim. If only one CPU is busy and the other three are idle, investigate the hot thread and its CPU placement rather than claiming the whole host has run out of compute. In either case, preserve the time window and measurements that justify your conclusion.
The diagnostic sequence is therefore straightforward: use load average to notice a trend; use repeated run-queue and CPU-time measurements to test saturation; use per-CPU and process/thread metrics to locate contention; and profile only when you need to explain the busy code path. Next, you will apply the same evidence-first reasoning to memory pressure, where cache, swapping, and memory limits can likewise make a single headline metric misleading.