Recommended resources
The freely available resources this lesson will direct you to.
- The Linux 'OOM Killer' is Crashing Your System: How to Optimize Your Swap in 2026www.youtube.com
- Linux Crash Course - Understanding Memory and Swap Usagewww.youtube.com
- Control Group v2 — The Linux Kernel documentationkernel.org
- Chapter 39. Configuring an operating system to optimize memory access | Monitoring and managing system status and performance | Red Hat Enterprise Linux | 9 | Red Hat Documentationdocs.redhat.com
Hello. In the previous lesson, you used load average as a starting clue and tested CPU saturation with run-queue, per-CPU, process, and profiling evidence. Memory diagnosis needs the same discipline: a host can show very little free RAM without being in trouble, while a memory-limited service can fail even when the host has RAM available.
This lesson will help you distinguish useful page cache from costly reclaim, identify active swapping, inspect a workload’s cgroup limits, and establish whether an out-of-memory (OOM) event caused a failure. Allow about 40 minutes, including the selected viewing and reading.
Start with the memory Linux can make available
Linux uses otherwise idle RAM to cache file contents. That improves later reads, but it makes the word used ambiguous: RAM holding a clean cached file page is occupied, yet Linux can generally reclaim that page if an application needs space. A process’s anonymous memory—such as much of its heap and stack—has no ordinary file copy to discard. Reclaiming it may require swap, if swap is available.
Watch how free presents this distinction. The video’s emphasis on available is useful for a first host-level check; treat it as an estimate, not an exact guarantee or a measure of what a container can use.
Linux Crash Course - Understanding Memory and Swap Usage
Watch “Linux Crash Course - Understanding Memory and Swap Usage” from Learn Linux TV for a visual explanation of free RAM, cached RAM, and swap.
Watch reading free for the initial choice between the free and available columns. Then watch cache and availability to see why a small free value need not mean a shortage. Finally, swap basics introduces the slower backing store; we will refine how to interpret swap usage below.
For a more precise account of the two kinds of pages, read the short “Overview of a system’s memory” subsection in the Red Hat Enterprise Linux documentation.
Read the Red Hat documentation to connect the free display to file-backed page cache and anonymous process memory.
In Chapter 39, subsection 39.2, “Overview of a system’s memory,” begin with the paragraph opening “The Linux Kernel is designed to maximize…” Read the memory overview through the end of the “Anonymous memory” definition, just before Figure 39.1. Focus on where a page’s contents can be recovered from if its RAM is needed elsewhere.
Now take a host snapshot:
free -h
Suppose it reports 16 GiB total RAM, 0.5 GiB free, 4.5 GiB in buff/cache, and 4 GiB available. The half-gigabyte free value is not evidence by itself that applications are about to fail. available estimates how much RAM can be supplied without swapping, accounting for memory that is free or reasonably reclaimable. It is not simply the cache column added to free RAM: some cache may be in active use, and reclaim has a cost.
This distinction matters operationally. Evicting a clean file page can release RAM, but reading that file again may require storage I/O. Modified (dirty) file pages must be written back before they can be discarded. A cache-heavy host can therefore have adequate memory capacity while still experiencing performance costs if its useful cache is repeatedly displaced.
Look for reclaim and current swap activity
A swap-used number is a stock: it tells you how much swap is occupied now, not how quickly pages are moving. Some pages can remain in swap long after the pressure that put them there has passed. Check both capacity and activity:
free -h
swapon --show
vmstat 1 6
As in the CPU lesson, set aside the first vmstat report when judging the current interval; several fields there summarize activity since boot. In the subsequent one-second reports, si and so show swap-in and swap-out activity. Repeated nonzero values during rising latency are more persuasive evidence of a swapping problem than a nonzero swap-used total alone. Zero si and so do not rule out costly file-cache reclaim or a cgroup-specific limit.
The supplied schematic shows the basic reason swapping can hurt a service:
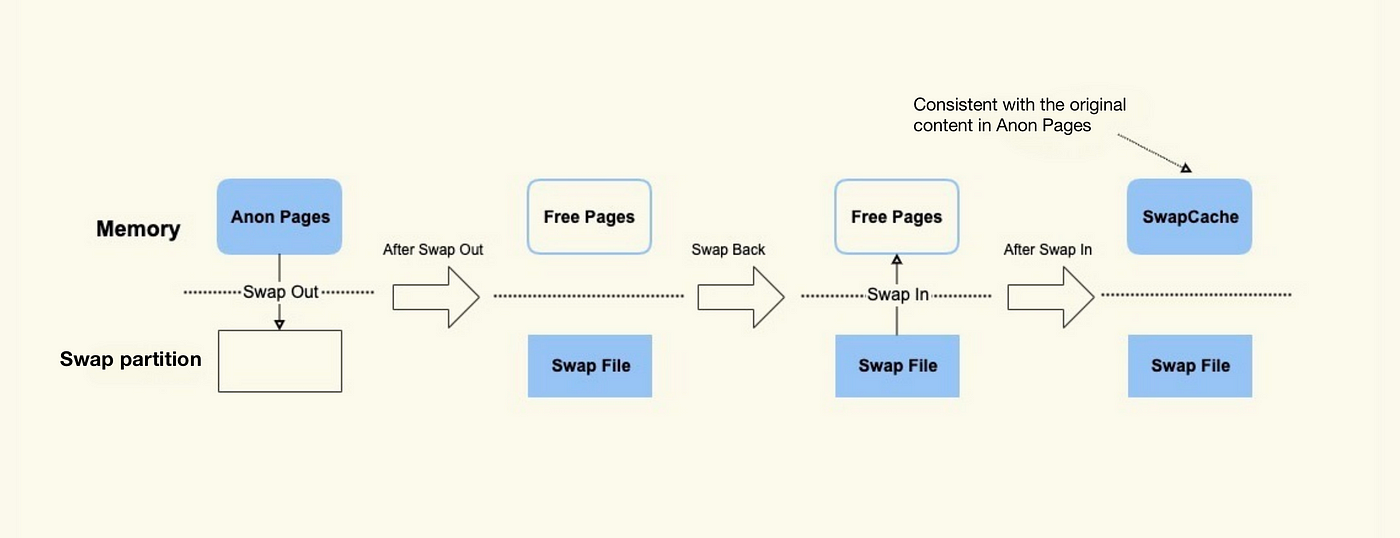
The drawing is intentionally simplified. A swapped-out page is not necessarily in the depicted “SwapCache” state, and page cache for ordinary files is different from swap backing for anonymous memory. The useful diagnostic question is whether the workload is repeatedly paying to reclaim and retrieve pages it still needs, rather than whether swap exists at all.
If your kernel exposes pressure stall information, add:
cat /proc/pressure/memory
The some line reports time when at least one task was stalled by memory pressure; full reports time when all non-idle tasks were stalled. Its avg10, avg60, and avg300 values describe different recent windows. Sustained stalls alongside service latency strengthen a pressure diagnosis. A single reading, or a large swap allocation with no current stalls, does not establish one.
Check the workload’s boundary, not only the host
A service or container may be subject to a cgroup memory limit well below host capacity. Cgroup v2 accounts more than process heaps: it also tracks page cache and some kernel memory charged to the group. Consequently, a process’s resident-memory figure alone may not explain why its cgroup is at its limit.
Read the Linux kernel documentation selectively. The interface is detailed; the key distinction for diagnosis is between usage, a reclaim/throttle boundary, and a hard limit.
Control Group v2 — The Linux Kernel documentation
Read the Linux kernel’s cgroup v2 documentation to understand what is charged to a workload and what its principal memory boundaries do.
In “Memory,” read tracked usage before “Memory Interface Files.” There, find the entries named memory.current, memory.high, and memory.max. Read current usage, the high boundary, and the hard limit. Notice that crossing memory.high and exhausting memory.max have different consequences.
On a cgroup v2 host, first identify the affected process’s cgroup:
cat /proc/1234/cgroup
Replace 1234 with the affected PID. For example, if the host reports 0::/system.slice/example.service, inspect that directory under /sys/fs/cgroup. The following path is illustrative; use the path you actually found:
cg=/sys/fs/cgroup/system.slice/example.service
cat "$cg/memory.current" "$cg/memory.high" "$cg/memory.max"
These values are in bytes; max means no limit at that level, not necessarily no limit in an ancestor cgroup. If memory.current is near a finite memory.max, the service can encounter its own boundary while free -h still shows ample host-wide available RAM. If usage repeatedly crosses memory.high, the workload may spend time reclaiming memory and slow down without an OOM kill. Proximity to a limit alone is not proof of impact: look for reclaim, stalls, and events in the same time window.
Establish what happened at an OOM event
The cgroup’s counters and footprint breakdown make the boundary observable. Read these reference entries as a guide to the files, rather than trying to memorize every memory.stat field.
Control Group v2 — The Linux Kernel documentation
Continue in the Linux kernel’s cgroup v2 documentation to learn which counters distinguish reclaim, limit hits, and kills.
Under “Memory Interface Files,” find memory.events and read event scope. Continue through the high, max, oom, and oom_kill descriptions, from limit events. Under memory.stat, locate the anon and file entries; read footprint types. Finally, find memory.swap.current and memory.swap.max; read swap usage and its limit. Stop before memory.swap.events.
Collect the relevant files from the affected cgroup, preferably more than once during the incident:
cat "$cg/memory.events"
grep -E '^(anon|file|shmem|file_dirty|file_writeback) ' "$cg/memory.stat"
cat "$cg/memory.swap.current" "$cg/memory.swap.max"
Interpret changes in counters, not just their absolute values:
- A rising
highcount supports repeated throttling and direct reclaim atmemory.high; that boundary does not itself invoke the OOM killer. - A rising
maxcount records attempts to exceedmemory.max. Reclaim may still succeed, somaxdoes not mean a process was killed. oomindicates an OOM condition was encountered;oom_killcounts processes killed by an OOM killer. Neither should be treated as a complete explanation without its time window and context.memory.stathelps distinguish a footprint dominated byanonfrom one dominated byfile. Itsfilefigure includes tmpfs and shared memory; do not addshmemtofileas though they were independent totals.
memory.events is hierarchical: a parent’s counts can rise because of activity in a descendant. If you need events local to exactly that cgroup, inspect memory.events.local. memory.swap.current reports the cgroup’s current swap usage separately from its current RAM usage; its limit, memory.swap.max, can also constrain the options available for reclaim.
Finally, correlate those counters with kernel messages from the relevant boot and time window:
journalctl -k -b --since "30 minutes ago" | grep -Ei 'out of memory|oom|killed process'
An OOM log can identify the killed PID and help distinguish a cgroup-limited OOM from a host-wide one. If a reboot followed the incident, investigate the previous boot’s logs if retained. A killed process may no longer appear in a live process list, and current memory usage may have fallen because the kill released memory. Preserve timestamps rather than using the post-incident snapshot to dismiss the event.
Turn observations into a diagnosis
Consider two services with rising request latency:
Service A: The host has several GiB available; host vmstat shows no sustained swap traffic. Its cgroup is close to a finite memory.max, however, and its max, oom, and oom_kill counters rise during the failures. Kernel messages identify an OOM kill in that cgroup. This supports workload-limit exhaustion, not a claim that the whole host ran out of RAM. The next investigation is why that cgroup’s charged footprint grew or why its limit no longer accommodates the workload.
Service B: Host available falls, vmstat repeatedly shows swap-in and swap-out, and memory stalls rise while latency worsens. There is no new OOM kill. This supports active memory pressure with performance degradation, not an OOM-termination diagnosis. Inspect the affected workloads and their anon and file footprints before deciding whether demand, cache churn, or an imposed limit is driving reclaim.
In either case, avoid making “drop caches,” “disable swap,” or “raise the limit” the automatic first response. Those changes can erase evidence or move the failure elsewhere. First establish which boundary is tight, which pages are being reclaimed, whether work is stalling, and whether a kill occurred.
Key takeaways
Low free RAM is normal when Linux is productively caching files. To diagnose pressure, combine host available memory with interval evidence of swapping or stalls, then inspect the affected cgroup’s usage, limits, footprint, and changing event counters. Use time-matched kernel logs to confirm an OOM kill and its scope; do not infer one from a high memory percentage alone.
The next lesson applies this evidence-first method to storage bottlenecks. That will also help distinguish I/O caused by memory reclaim from an underlying storage problem.