Recommended resources
The freely available resources this lesson will direct you to.
Hello. In the previous lessons, you investigated CPU, memory, storage, service-startup, and network failures, then looked at how a service’s privileges can affect its behavior. This final lesson in the Linux module brings those threads together. You’ll build a reusable, evidence-first runbook: something an operator can follow when a production host is unhealthy without assuming that the first unusual metric is the cause.
Allow about 45 minutes. The result is a template you can adapt to an ordinary Linux server or a host running container workloads. Its purpose is to help you preserve evidence, narrow the fault, choose a safe response, and show whether that response worked.
Begin with the symptom and the decision at hand
“The host is slow” is not yet a diagnosis—or even a precise problem statement. Before opening a shell, establish what should be happening, what is happening instead, when the difference began, and who or what is affected. A service timing out on one host calls for a different response from an entire fleet failing after a shared configuration change.
An evidence-first runbook must also serve an urgent operational decision: does anything need to be stabilized now? If data may be corrupted or users are losing service rapidly, protecting the workload can take priority over finding the ultimate cause. Preserve what evidence you reasonably can, but do not delay a justified mitigation merely to complete a checklist.
Read the selected portions of Google’s Troubleshooting Methodology: A Learning Path. The distinction to carry into your runbook is between an observation, a hypothesis, a test, and a treatment. A treatment may restore service without proving the hypothesis.
Troubleshooting Methodology: A Learning Path
Read Google's troubleshooting model to establish the decision-making structure behind the host runbook.
In “Theory,” read the model, starting with the paragraph that introduces hypotheses and ending with corrective action. Under “In Practice,” read from the opening of “Problem Report” through the first response described in “Triage”: report and triage. Then, in “Test and Treat,” find the list beginning “An ideal test should have mutually exclusive alternatives” and read test design. Finally, immediately before “Negative Results Are Magic,” read note taking. Notice why a test that rules something out is worth recording.
For this runbook, write the intake as a compact record, not a vague alert title:
Expected: Requests ordinarily complete within the service’s established latency range.
Observed: Latency and timeouts increased; record the measured values and time window.
Scope: Which service, hosts, users, and operations are affected? Are healthy peers available for comparison?
Urgency: Is there an immediate risk to availability or data? Who can authorize a mitigating change?
Context: What changed recently—workload, deployment, configuration, host, or dependency?
The scope question guards against a common mistake: diagnosing one Linux host when the problem is shared by a dependency. Conversely, an unhealthy host among otherwise healthy peers makes host-local evidence particularly valuable.
Sweep resources systematically, then follow the strongest clue
A familiar command is not a strategy. top may show high load, but load alone cannot tell you whether runnable tasks are waiting for CPU or tasks are blocked elsewhere. A repeatable first pass asks the same questions of each relevant resource: How busy is it? Is work waiting? Are errors occurring?
Watch Brendan Gregg explain how a problem statement and the USE method—utilization, saturation, errors—keep an investigation focused. The video is an overview of the method, not a requirement to collect every conceivable metric during an outage.
Linux Performance Tools, Brendan Gregg, part 1 of 2
Watch “Linux Performance Tools, Brendan Gregg, part 1 of 2” by Brendan Gregg for the reasoning behind a short, structured first pass.
Watch problem framing for the questions that make a performance report actionable. Then watch the USE method for how the three questions expose both likely bottlenecks and gaps in your instrumentation.
Read the corresponding parts of Gregg’s The USE Method with a practical aim: decide which observations belong in a short host checklist, and which require deeper investigation only when indicated.
Read Brendan Gregg's explanation of USE to turn the method into host-specific checks rather than a list of commands to run blindly.
Begin in “Summary” with its scope. In “Does Low Utilization Mean No Saturation?”, read the burst example; then use “Resource List” to identify the CPU, memory, network, and storage resources in your checklist. In “Metrics,” read the metric examples and the guidance following the table. Finish with “Suggested Interpretations” and “Cloud Computing,” from interpretation and limits. Pay particular attention to the warning that a host can appear underused while a shorter burst—or a software-imposed limit—is causing saturation.
The flowchart makes the method’s stopping rule explicit: a suspicious resource deserves investigation, but a finding is not automatically the problem. If it does not explain the symptom, continue checking other resources.
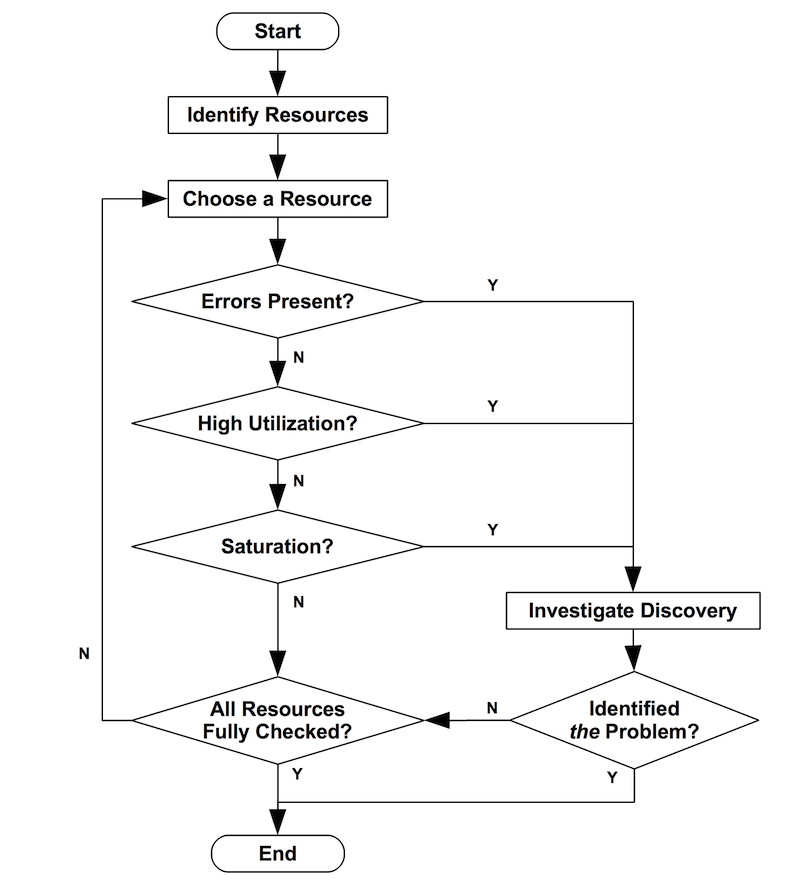
On a Linux host, the first pass can remain small:
| Resource or layer | Evidence to seek | Important qualification |
|---|---|---|
| CPU | Per-CPU busy time, runnable tasks, CPU throttling | Load average alone does not establish CPU saturation. |
| Memory | Available memory, active swapping or reclaim, OOM events | Little “free” memory may simply reflect useful page cache. |
| Storage | Device latency and queueing; filesystem space and inodes; errors | A busy percentage alone is not a universal disk threshold. |
| Network | Interface errors or drops, routes, sockets, name resolution | A failed connection can be remote or policy-related, not a faulty NIC. |
| Service and limits | Unit state, journal, process exits, file descriptors, cgroup events | A healthy host-wide average can conceal a failing service or constrained cgroup. |
Compare measurements with the incident window, a healthy peer, and the affected workload. Counters that have not increased during the failure are different evidence from counters rising rapidly now. If historical metrics or a tool are unavailable, record the gap; do not fill it with a guess.
A runbook you can adapt
The following is a template, not a script to paste onto every production machine. Replace the placeholders, use approved access, and omit checks that are irrelevant to the symptom. Keep the investigation record beside the commands so the next operator can tell what was observed and when.
1. Establish identity, scope, and safety
Record the incident start time and time zone; host identity and role; affected service; a known-good comparison if available; and the reported user-visible symptom. Note whether the host is serving traffic, holding important state, or running workloads subject to cgroup limits. Check existing monitoring for the onset and duration of the symptom before relying on a single live sample.
Start with bounded, primarily observational checks:
date -Is
hostname
uptime
systemctl --failed --no-pager
uptime supplies context and load trends, not a CPU verdict. On hosts with sensitive names, addresses, logs, or process arguments, store the resulting evidence only in the approved incident location. Access production hosts with the minimum privileges needed; some later commands require elevated access.
Decision gate: If there is imminent data loss or severe user impact, identify an approved stabilization option and its owner now. Otherwise, continue with the short sweep before changing anything.
2. Capture a short resource sweep
If sysstat utilities are installed, collect a few interval samples while the symptom is present:
vmstat 1 6
mpstat -P ALL 1 5
iostat -xz 1 5
free -h
For vmstat and iostat, focus on the interval rows after the initial since-boot summary. In vmstat, compare runnable work (r), blocked work (b), swapping activity (si and so), and CPU time categories. Use mpstat to detect a busy individual CPU hidden by a host-wide average. In iostat, examine device read/write demand alongside latency and queue-related fields; interpret them against that device and workload, not a fixed percentage rule. If these tools are absent, use already-collected monitoring and record what could not be checked. Do not install packages in the middle of an incident merely to complete the template.
Check capacity separately from I/O performance, substituting the affected filesystem path:
df -h <affected_path>
df -i <affected_path>
Space and inodes can fail independently. A full filesystem can make a service unhealthy even when device latency is unremarkable.
3. Follow the symptom into the responsible layer
Choose the relevant branch; each branch should either strengthen a hypothesis or narrow it.
- CPU or memory: Identify affected processes with
psor a boundedtopsession. Compare CPU activity with runnable work rather than assuming a high load average means CPU contention. For memory, look for active reclaim or swapping and OOM evidence in kernel and service logs. If host capacity looks adequate but one container or service is failing, inspect its cgroup limits and CPU-throttling or memory-event counters. On a cgroup v2 host, the relevant files includecpu.statandmemory.eventsunder that unit’s cgroup; first establish which cgroup the process actually belongs to. - Storage: Compare device latency and queueing with the application’s I/O demand, filesystem capacity, and kernel errors. If one process is suspected, process I/O metrics can test whether it is generating the demand. A slow device and a surge in writes are evidence of a bottleneck, but not yet evidence of why writes surged.
- Service startup or failure: For the affected unit, inspect its effective configuration, state, exit result, dependencies, and journal during the failure window. Recent privilege or sandbox changes deserve consideration, but should not be assumed guilty merely because they are recent.
- Connectivity: Establish whether the failure is name resolution, local listening, routing, or a TCP connection to a particular dependency. Test from the affected host and, where possible, compare with a healthy peer; a successful test from your workstation does not exercise the same path.
Representative targeted checks, after substituting a real unit and destination, are:
systemctl status <unit> --no-pager
journalctl -u <unit> --since "20 minutes ago" --no-pager
journalctl -k --since "20 minutes ago" --no-pager

ip -brief addr
ip route get <dependency_ip>
ss -lnt
getent ahosts <dependency_dns_name>
These commands answer different questions. For example, getent tests the host’s configured name-resolution path; it does not establish that the resolved address accepts a TCP connection. A kernel log may disclose OOM kills or I/O errors, while a service journal may show the operation that failed. Adjust the time window to the incident, and remember that logs may be incomplete after rotation or reboot.
Defer higher-impact techniques—extended packet captures, system-call tracing, profiling, load generation, and configuration changes—until a specific hypothesis warrants them and their production cost has been assessed.
4. Record the inference, act, and verify
For each plausible cause, maintain a short evidence trail:
| Field | Record |
|---|---|
| Observation | Metric or log entry, value, source, host, and time window |
| Hypothesis | What mechanism could produce the reported symptom? |
| Discriminating check | What result would support or weaken it? |
| Result | Include negative results and unavailable evidence |
| Confidence | Confirmed, likely, or still unknown |
| Next decision | Continue investigating, mitigate, or escalate |
Before an intervention, record the expected effect, authorization, possible side effects, and rollback. A restart, traffic shift, or limit change may erase transient evidence and may briefly worsen availability. Afterward, verify both the user-visible symptom and the resource signal that motivated the action. If the service recovers but the proposed mechanism remains unproven, report a successful mitigation with an open root-cause question—not a definitive diagnosis.
To keep the runbook reusable, finish each use by correcting commands that were unavailable, adding missing service-specific paths or metrics, and removing checks that produced no useful decision.
What evidence-first looks like in practice
Suppose an application’s request latency rises from its usual range to sustained timeouts on one host. Its one-minute load average is high. It would be tempting to write “CPU overloaded” and add compute capacity.
The sweep instead shows substantial CPU idle time, few runnable tasks, and several blocked tasks. Available memory is stable, with no active swapping. One storage device shows sharply increased write demand, queueing, and I/O latency during the same window; the affected service’s journal contains write timeouts. Filesystem space and inode usage are not near exhaustion. These observations make storage I/O delay a stronger explanation than CPU saturation. They do not yet establish whether the new writes arose from an application change, a scheduled job, or another process.
The next useful check identifies who generated the additional writes and when they began. If an approved mitigation reduces those writes, verify that device latency and request latency recover. Record the sequence even if the mitigation succeeds: “Storage contention was likely; the source of increased writes is under investigation” is more accurate than declaring a root cause from a busy-device graph.
That discipline is the runbook’s central feature. It turns “try commands until something looks strange” into a reproducible account of symptom, measured resource behavior, competing explanations, safe action, and observed outcome.
Key takeaways
A production host runbook should start with the user-visible problem and immediate risk, then conduct a short, systematic resource sweep. Utilization, saturation, and errors help locate pressure, while service logs, cgroup evidence, and targeted connectivity checks explain cases that host-wide averages miss. Keep observations separate from hypotheses, preserve negative results, and verify a mitigation against the original symptom.
This completes the Linux host-diagnostics module. Next, the course moves from the host to AWS networking, beginning with IPv4 CIDR subdivisions for a multi-Availability-Zone VPC.