Recommended resources
The freely available resources this lesson will direct you to.
Hello! Welcome to the next lesson in our module on advanced property valuation.
In previous lessons, we explored the Sales Comparison and Cost approaches. These methods provide a property's value at a single point in time, based on market comparables or replacement cost. However, as an investor, you're not just interested in today's value, but in the future performance of your asset. This requires a dynamic, forward-looking approach.
Today, we'll build the foundation for one of the most powerful valuation techniques: the Discounted Cash Flow (DCF) analysis. Your learning outcome is to assemble a complete multi-year cash flow statement for a discounted cash flow (DCF) analysis. This statement, often called a "pro forma," is a detailed financial projection of all the income and expenses an investment property is expected to generate throughout your planned holding period.
Think of this as creating the blueprint for a financial model. You'll define the inputs, project them over time based on specific assumptions (like growth rates), and structure them logically to arrive at a bottom-line cash flow for each year.
1. The Structure of a Real Estate Pro Forma
A pro forma cash flow statement systematically forecasts a property's financial performance. It begins with the total potential income and progressively subtracts vacancies, expenses, and financing costs to determine the net cash flow available to the investor.
To start, let's get familiar with the standard layout and terminology.
The Real Estate Proforma: A Beginner's Guide
The following article, 'The Real Estate Proforma: A Beginner's Guide' from PropertyMetrics, provides an excellent overview of the basic structure. We will build upon this foundation throughout the lesson.
Please read the first main section, 'How to Create a Simple Real Estate Proforma'. Focus on understanding the sequence of calculations from Potential Gross Income down to Before Tax Cash Flow. We've covered many of these individual terms (like NOI) before; the focus now is on how they fit together in a flow.
As you've just read, the basic flow is:
- Potential Gross Income
- (-) Vacancy & Credit Loss
- = Effective Gross Income (EGI)
- (-) Operating Expenses (OpEx)
- = Net Operating Income (NOI)
- (-) Below-the-line costs (CapEx, Debt Service)
- = Before Tax Cash Flow (BTCF)
Now, let's move from this single-period view to a multi-year projection.
2. Projecting Operating Cash Flows Over Time
A DCF analysis requires projecting these cash flows over a typical holding period, such as 5, 7, or 10 years. This involves making informed assumptions about how each line item will change year after year.
Let's break down how to project the key components. The next reading provides a very detailed explanation of each line item.
The Real Estate Proforma: A Beginner's Guide
This next reading from the same PropertyMetrics article goes into granular detail on each component of a more complex pro forma. This is the level of detail required for a robust analysis.
Read the section titled 'Detailed Commercial Real Estate Proforma Example'. You don't need to memorize every single term, but focus on understanding the logic behind projecting: Income: How Potential Rental Income is projected, and how vacancy is accounted for. Expenses: The distinction between fixed and variable expenses and why it matters for projections. Capital Expenditures (CapEx): How these differ from OpEx and how they are handled in the cash flow.
Let's synthesize this information into a step-by-step projection process.
Step 1: Projecting Income
- Potential Rental Income (PRI): Start with the current rent for Year 1. For subsequent years, apply an annual rent growth rate. This rate should be based on your analysis of the market, expected inflation, and any rent escalation clauses in existing leases.
- Example: If Year 1 PRI is €50,000 and you assume a 3% annual growth rate, Year 2 PRI will be €50,000 * 1.03 = €51,500.
- Vacancy & Credit Loss: This is typically projected as a stable percentage of PRI, based on the property's history and the market's average vacancy rate.
- Effective Gross Income (EGI): Calculated for each year:
EGI = PRI * (1 - Vacancy Rate). - Other Income: Project any other income (e.g., parking, laundry) with its own appropriate growth rate.
Step 2: Projecting Operating Expenses (OpEx)
You'll need to project each category of operating expense. It's useful to think about them in terms of their growth drivers:
- Fixed Expenses: Property taxes (Impuesto sobre Bienes Inmuebles - IBI) may increase based on municipal reassessments, not occupancy. Insurance premiums may have their own trend.
- Variable Expenses: Utilities, cleaning, and some maintenance costs will vary with occupancy and should be grown by an inflation-like factor.
- Management Fees: Often a percentage of EGI, so they will grow as your income grows.
For a Spanish context, the list of deductible expenses provided by the Agencia Tributaria is a great checklist for ensuring you've covered all relevant operating expenses.
Cálculo del rendimiento del alquiler de un inmueble...
While this resource from the Agencia Tributaria is for tax purposes (which we'll cover in detail in Module 9), it provides an authoritative list of expenses to consider in your operating expense forecast.
Quickly review the list under 'Gastos deducibles'. Note items like 'IBI, tasa de basuras' (Taxes), 'primas de contratos de seguros' (Insurance), and 'gastos de conservación y reparación' (Maintenance). These are core operating expenses you must project in your pro forma. We will ignore interest and amortization for the NOI calculation.
By projecting EGI and Total OpEx for each year, you can calculate the projected Net Operating Income (NOI) for the entire holding period.
Step 3: Projecting "Below-the-Line" Items
These are cash flows that are not part of NOI but are essential for determining the final cash in your pocket.
- Capital Expenditures (CapEx): These are large, non-recurring expenses. You can project them in two ways:
- Lumpy Expenditures: Place the specific estimated cost in the year it's expected to occur (e.g., €15,000 for a new roof in Year 5).
- Replacement Reserve: Set aside a small amount each year (e.g., 1-3% of EGI) to build up a fund for future CapEx. This smooths out the cash flow.
- Debt Service: This is your annual mortgage payment (principal and interest). For a fixed-rate mortgage, this amount will be constant each year. You already know how to calculate this from Module 2.
Subtracting CapEx and Debt Service from NOI gives you the Pre-Tax Cash Flow (BTCF) for each year.
3. Projecting the Reversion Cash Flow
The operating cash flows are only part of the story. A complete statement must also include the cash flow from the eventual sale of the property. This is known as the reversion cash flow.
The Real Estate Proforma: A Beginner's Guide
Let's return to the PropertyMetrics guide to understand how to forecast the final sale.
Read the subsection 'Future Sale Proceeds'. Focus on how the future sale price is estimated using the NOI of the following year (NOI in Year 6 for a 5-year hold) and a projected 'exit cap rate'.
The process is as follows:
-
Estimate the Future Sale Price: The most common method is the terminal capitalization method.
- : The Net Operating Income projected for the year after you sell.
- Exit Cap Rate: Your assumption of what the market cap rate will be for this type of property when you sell in Year N. This is a critical assumption. A higher exit cap rate results in a lower sale price.
-
Calculate Net Sale Proceeds:
- Selling Costs: Include broker commissions, legal fees, and any applicable taxes (like plusvalía municipal). This is often estimated as a percentage of the gross sale price (e.g., 5-7%).
-
Pay Off the Mortgage: At the time of sale, you must use the proceeds to pay off the remaining balance of your mortgage.
The final reversion cash flow is: Net Sale Proceeds - Remaining Mortgage Balance. This is a large, positive cash flow that occurs in the final year of your holding period.
4. Assembling the Complete Statement
Now, we combine everything into a single, cohesive statement. The table below shows the structure. Year 0 represents the initial investment (a negative cash flow), and Years 1 through N represent the holding period.

Notice how the table lays out each year's calculation column by column. The key is to structure it so that the final line, Total Cash Flow, represents the net cash to or from the investor in each period.
| Line Item | Year 0 | Year 1 | ... | Year N |
|---|---|---|---|---|
| Net Operating Income (NOI) | NOI_1 | ... | NOI_N | |
| (-) Capital Expenditures | CapEx_1 | ... | CapEx_N | |
| (-) Debt Service | DS_1 | ... | DS_N | |
| = Pre-Tax Cash Flow (BTCF) | BTCF_1 | ... | BTCF_N | |
| Reversion Cash Flow | ||||
| Net Sale Proceeds | + NSP_N | |||
| (-) Mortgage Payoff | - LoanBal_N | |||
| Total Cash Flow for DCF | (Initial Investment) | BTCF_1 | ... | BTCF_N + Reversion |
This final Total Cash Flow for DCF row is precisely the data we need to perform a DCF analysis.
Test your understanding!
You are analyzing a property with a 3-year holding period.
- Projected BTCF is €5,000 in Year 1, €5,200 in Year 2, and €5,400 in Year 3.
- In Year 3, you project the Net Sale Proceeds to be €90,000.
- The remaining mortgage balance at the end of Year 3 will be €140,000.
- Your initial investment (down payment + costs) in Year 0 was €60,000.
What is the "Total Cash Flow for DCF" for each year (Year 0, 1, 2, and 3)?
Show answer
The cash flow stream would be:
- Year 0: -€60,000 (the initial investment)
- Year 1: +€5,000 (the BTCF for Year 1)
- Year 2: +€5,200 (the BTCF for Year 2)
- Year 3: +€5,400 (BTCF for Year 3) + (€90,000 Net Sale Proceeds - €140,000 Mortgage Payoff) = €5,400 - €50,000 = -€44,600.
Wait, a negative cash flow at sale? Yes, this can happen if the mortgage balance is larger than the net proceeds. This would be a very poor investment outcome, but it demonstrates the importance of the calculation. (In a more typical scenario, the Net Sale Proceeds of €190,000 would result in a positive reversion of €50,000 and a total Year 3 cash flow of €55,400).
5. Preview: Modeling the Pro Forma in Code
Assembling this statement is a highly structured, repetitive calculation—perfect for modeling in code. While we will build a full Python model later in the course, it's useful to see how these financial concepts translate.
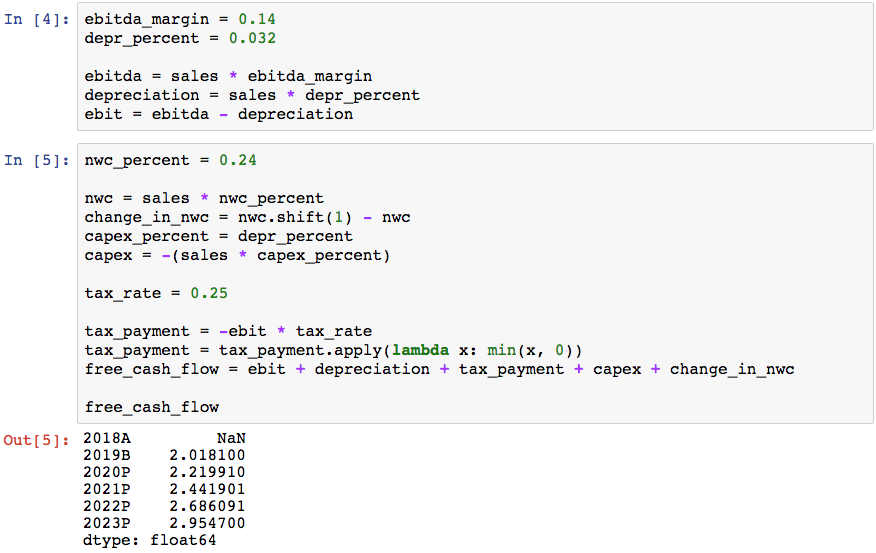
Just as this code projects corporate financial data, you can create a Python script that takes inputs like initial rent, growth rates, and expense assumptions, and then loops through the holding period to generate the full multi-year cash flow statement we've designed.
Conclusion
You have now learned how to construct the single most important tool for dynamic investment analysis: the multi-year cash flow statement. This pro forma is not just a collection of numbers; it's the financial story of your investment, from acquisition to disposition.
Key Takeaways:
- A multi-year cash flow statement (pro forma) projects all income and expenses over a holding period to forecast future performance.
- The process involves projecting operating cash flows (NOI, BTCF) for each year by applying growth and expense assumptions.
- A complete statement must also include the reversion cash flow, which is the net cash received from selling the property at the end of the holding period.
- The final output is a series of cash flows, one for each year, starting with the initial investment (Year 0) and ending with the combined operating and reversion cash flow (Year N).
Preview of the Next Lesson:
We have successfully assembled our forecast. But what do these future numbers mean for us today? In the next lesson, we will calculate a property's value using the DCF method by discounting projected cash flows and reversion value. We'll finally answer the question: "Based on this projected cash flow, what is this investment worth to me right now?"