Recommended resources
The freely available resources this lesson will direct you to.
Introduction
Welcome to our second lesson in the capstone module. In the previous lesson, we applied your techno-economic model to evaluate an evolutionary change to the Kroll process: upgrading to induction heating. We saw how a seemingly straightforward engineering improvement translates into a financial return (ROI) that is highly sensitive to external factors like electricity prices.
Today, we shift our focus from evolution to revolution. Instead of tweaking the incumbent process, we will evaluate the conditions under which it could be displaced entirely by a challenger technology. This addresses a core question for any strategic investor or executive in an established industry: when does a disruptive technology move from a laboratory curiosity to a genuine economic threat?
Our learning outcome for this lesson is to: Using your techno-economic model, evaluate the conditions (e.g., energy cost, carbon tax, capital cost) under which an alternative technology like the FFC Cambridge process would become economically viable.
We will dissect the FFC Cambridge process, not as chemical engineers, but as strategists—focusing on its fundamentally different cost structure. We will then use a comparative modeling approach to identify the specific economic tipping points that would favor this new technology over the time-tested Kroll process.
1. Understanding the Challenger: The FFC Cambridge Process
The FFC Cambridge process, developed in the late 1990s, proposes a radical simplification of titanium production. While numerous alternatives to Kroll have been attempted and failed, FFC represents one of the most promising and persistent efforts.
To build our comparative model, we first need to understand the key technical and economic differences between FFC and Kroll.
Development of the Fray-Farthing-Chen Cambridge Process
The following paper, 'Development of the Fray-Farthing-Chen Cambridge Process,' provides an excellent overview of the process and its potential advantages. As you read, focus on the core differences compared to the Kroll process we've studied.
Read the Abstract, Introduction, and the 'Concept of the FFC-Cambridge Process' section. Pay close attention to the descriptions of the inputs (feedstock), the basic process (electrochemical reduction), and the outputs (product form).
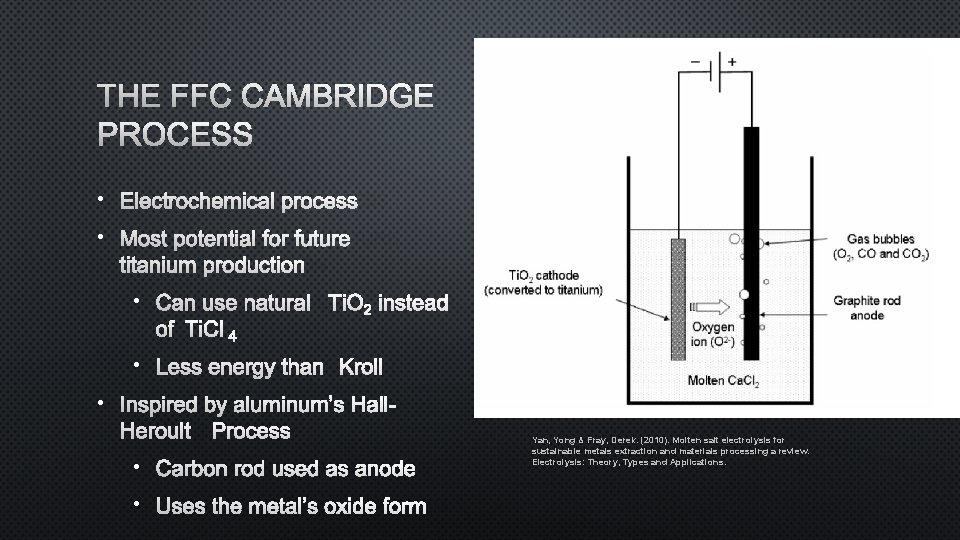
From your reading and the diagram, we can distill the key differences that will drive our economic model:
| Feature | Kroll Process | FFC Cambridge Process | Economic Implication |
|---|---|---|---|
| Feedstock | Titanium Tetrachloride (TiCl₄) | Titanium Dioxide (TiO₂) | Changes material input costs and eliminates the costly, energy-intensive carbochlorination step. |
| Core Process | Multi-step metallothermic reduction | Single-step electrochemical reduction | Potential for significantly lower Capital Expenditure (CAPEX) due to process simplification. |
| Energy | High energy use, mostly thermal | Fully electrical; potentially lower total energy intensity. | Sensitivity to electricity prices and the carbon footprint of the grid. |
| Product Form | Porous "sponge" | Porous powder or near-net-shape | Potential to skip costly sponge crushing, blending, and VAR melting steps, reducing downstream costs. |
| Emissions | CO/CO₂ from chlorination | CO/CO₂ (carbon anode) or pure O₂ (inert anode) | Creates a potential advantage in a carbon-taxed world. |
The core investment thesis for FFC is not just about being slightly better; it's about deleting entire steps from the value chain, as highlighted in the Orca Sciences article "There has to be a better way to make titanium". Each deleted step removes associated CAPEX, OPEX, and material losses.
2. Parameterizing the FFC Model
Now, let's quantify these differences by extracting key parameters from the literature. This is the critical data-gathering step in any techno-economic analysis.
Development of the Fray-Farthing-Chen Cambridge Process
We'll return to the paper on the FFC process. This time, we will extract specific quantitative data on energy consumption, feedstock costs, and the impact of using advanced, inert anodes.
Read the sections 'Towards Higher Efficiency for Titanium Extraction', 'A More Sustainable Feedstock', and 'A Carbon-Free Titanium Extraction Process'. Hunt for specific numbers related to: Energy Consumption: Look for comparisons between FFC and Kroll in kWh/kg. Note the different values reported (e.g., base case vs. improved). Feedstock Cost: Find the comparison between TiCl₄ and TiO₂ requirements and relative pricing. Inert Anodes: Note the energy consumption and efficiency figures when using inert anodes instead of carbon.
From this reading, we can assemble a set of parameters for our model. We'll use the 10,000 tonne/year plant from our previous lesson as the basis for comparison.
Kroll Process (Baseline from previous lesson & resources):
- Energy Intensity: ~50 kWh/kg Ti. This figure from resource LINK is a good benchmark for the primary extraction process.
- Feedstock: Requires ~4 kg of TiCl₄ to produce 1 kg of Ti. Let's estimate TiCl₄ at $1.50/kg, making the feedstock cost $6.00/kg Ti.
- Carbon Emissions: The carbochlorination reaction is TiO₂ + 2C + 2Cl₂ → TiCl₄ + 2CO. This produces 2 moles of CO for every mole of Ti.
- Molar mass of Ti ≈ 47.9 g/mol; Molar mass of CO ≈ 28.0 g/mol.
- This equates to (2 * 28.0) / 47.9 ≈ 1.17 kg of CO per kg of Ti. If this CO is vented and oxidized to CO₂, it becomes ~1.83 kg of CO₂ per kg of Ti. Let's use this as our process emissions factor.
FFC Cambridge Process (Modeled Scenarios):
We'll model an "Advanced FFC" case that reflects the potential of the technology with key improvements.
- Energy Intensity: With an inert anode, the paper suggests energy consumption can be ~17 kWh/kg Ti. This is a dramatic reduction from Kroll's 50 kWh/kg.
- Feedstock: Requires ~1.66 kg of pigment-grade TiO₂ per kg of Ti. The paper notes TiO₂ price is "typically double that of TiCl₄". If TiCl₄ is $1.50/kg, then TiO₂ is $3.00/kg.
- Feedstock cost = 1.66 kg * $3.00/kg = $4.98/kg Ti. This is interestingly lower than Kroll's feedstock cost.
- Carbon Emissions: With an inert anode, the only byproduct is O₂. Process emissions are zero. The carbon footprint is solely from the electricity source.
- Capital Cost: This is the hardest to estimate. However, by eliminating the chlorination plant and simplifying the reduction step, it's reasonable to model FFC's CAPEX as a fraction of Kroll's. Let's start with an assumption that the FFC plant CAPEX is 70% of an equivalent Kroll plant CAPEX.
3. Breakeven Analysis: Finding the Tipping Points
With our parameters defined, we can now analyze the conditions under which the "Advanced FFC" process becomes more economical than Kroll. We will focus on two key external variables: electricity price and carbon tax.
For this analysis, we will compare the variable operating costs (VarEx) per kg of titanium.VarEx = (Energy Intensity * Electricity Price) + Feedstock Cost + (Emissions * Carbon Tax)
Scenario 1: Breakeven on Electricity Price (No Carbon Tax)
Let's find the electricity price where VarEx_Kroll = VarEx_FFC, assuming a carbon tax of $0.
VarEx_Kroll = (50 kWh/kg * Price_Elec) + $6.00/kgVarEx_FFC = (17 kWh/kg * Price_Elec) + $4.98/kg
Setting them equal:50 * Price_Elec + 6.00 = 17 * Price_Elec + 4.9833 * Price_Elec = -1.02Price_Elec = -$0.031/kWh
This result is nonsensical, indicating that at any positive electricity price, the FFC process already has a lower variable cost due to its combined energy and feedstock advantages in our model. This highlights the immense potential of the process if the modeled parameters can be achieved at scale.
Scenario 2: Breakeven on Carbon Tax
Let's fix the electricity price at $0.07/kWh (our baseline from the last lesson) and find the carbon tax ($/tonne CO₂) that makes the two processes equal in cost.
VarEx_Kroll = (50 * $0.07) + $6.00 + (0.00183 tonnes_CO₂/kg_Ti * Tax_Carbon)VarEx_Kroll = $3.50 + $6.00 + (0.00183 * Tax_Carbon) = $9.50 + (0.00183 * Tax_Carbon)
VarEx_FFC = (17 * $0.07) + $4.98 + 0 = $1.19 + $4.98 = $6.17
Setting them equal:$9.50 + (0.00183 * Tax_Carbon) = $6.170.00183 * Tax_Carbon = -$3.33
Again, we get a nonsensical negative number. This tells us that at an electricity price of $0.07/kWh, the FFC process is already substantially cheaper based on variable costs alone, even before considering any carbon tax. The carbon tax only widens its advantage.
A More Realistic View: Total Cost of Production
The analysis above ignores CAPEX. An investor needs to recover their capital. Let's include an annualized CAPEX cost to compare the total cost of production. Assume a 10-year straight-line depreciation and a CAPEX of $300M for the Kroll plant.
Annual_CAPEX_Kroll = $300M / 10 = $30M/yearCAPEX_per_kg_Kroll = $30,000,000 / 10,000,000 kg = $3.00/kg Ti
Now, let's assume FFC's CAPEX is 70% of Kroll's ($210M).
Annual_CAPEX_FFC = $210M / 10 = $21M/yearCAPEX_per_kg_FFC = $21,000,000 / 10,000,000 kg = $2.10/kg Ti
Let's recalculate the total cost per kg at $0.07/kWh electricity and zero carbon tax:
- Total Cost Kroll = VarEx + CAPEX_cost =
$9.50 + $3.00 = **$12.50/kg** - Total Cost FFC = VarEx + CAPEX_cost =
$6.17 + $2.10 = **$8.27/kg**
This is a powerful result. Under these assumptions, the FFC process is not just marginally better; it's over 30% cheaper. This would be a game-changer, bringing the ingot cost closer to the $10/kg target mentioned by ARPA-E, which could unlock new mass-market applications for titanium.
Here's a simple Python script to explore the sensitivity of this conclusion to the FFC CAPEX assumption. What if FFC is not cheaper to build?
# --- Parameters ---
# Kroll
KROLL_ENERGY_KWH_PER_KG = 50
KROLL_FEEDSTOCK_COST_PER_KG = 6.00
KROLL_CAPEX_PER_KG = 3.00 # Annualized


# FFC (Advanced)
FFC_ENERGY_KWH_PER_KG = 17
FFC_FEEDSTOCK_COST_PER_KG = 4.98


# Market
ELEC_PRICE = 0.07


# --- Calculation ---
kroll_total_cost = (KROLL_ENERGY_KWH_PER_KG * ELEC_PRICE) + KROLL_FEEDSTOCK_COST_PER_KG + KROLL_CAPEX_PER_KG
print(f"Kroll Total Cost: ${kroll_total_cost:.2f}/kg")


# --- Sensitivity on FFC CAPEX ---
print("\n--- FFC Sensitivity Analysis ---")
for capex_factor in [0.7, 1.0, 1.2, 1.5]: # FFC CAPEX as a multiple of Kroll's
    ffc_capex_per_kg = KROLL_CAPEX_PER_KG * capex_factor
    ffc_total_cost = (FFC_ENERGY_KWH_PER_KG * ELEC_PRICE) + FFC_FEEDSTOCK_COST_PER_KG + ffc_capex_per_kg

    print(f"If FFC CAPEX is {capex_factor*100:.0f}% of Kroll's, Total FFC Cost: ${ffc_total_cost:.2f}/kg")
    if ffc_total_cost < kroll_total_cost:
        print("  -> FFC is cheaper.")
    else:
        print("  -> Kroll remains cheaper.")
Running this script shows that even if the FFC plant costs the same as a Kroll plant (a factor of 1.0), its total cost is still only $9.17/kg, well below Kroll's $12.50/kg. It's only when the FFC plant becomes substantially more expensive to build (around 1.7x the CAPEX of Kroll in this model) that Kroll retains its cost leadership.
Conclusion: The Investor's Dilemma
This analysis demonstrates that on paper, a mature FFC Cambridge process with inert anodes is not just a viable alternative but a vastly superior one. The economic case, driven by massive energy savings and process simplification, is compelling.
So why does Kroll still dominate? This is the investor's dilemma and the crux of evaluating disruptive technology. Our model's parameters for FFC are based on optimistic, albeit documented, results. The real-world challenges lie in achieving these metrics reliably, at scale, and over a long operational lifetime.
Key Takeaways:
- Modeling Disruption: To evaluate a disruptive technology, you must model its fundamentally different cost structure, focusing on how it eliminates or changes cost drivers (feedstocks, process steps, energy type).
- Identifying Tipping Points: A techno-economic model's true power lies in identifying the breakeven points for key variables. In this case, we found that for FFC, the tipping point has less to do with external factors (like carbon taxes) and more to do with internal, technical execution—specifically, whether the projected CAPEX, energy efficiency, and operational reliability can be realized commercially.
- The Difference Between a Paper Study and an Investment: An attractive cost model is a necessary, but not sufficient, condition for investment. The next step is deep technical due diligence to gain conviction that the modeled parameters (e.g., 17 kWh/kg energy use, long-life inert anodes, 99%+ uptime) are achievable outside of a laboratory.
Preview of the Next Lesson:
We have now analyzed both an incremental improvement to Kroll and a revolutionary alternative in FFC. You have all the analytical components needed for our final capstone task. In the next lesson, you will synthesize this knowledge to: Develop a high-level investment thesis for a hypothetical new entrant or for an existing small-scale producer in the titanium market, justifying the strategic approach based on technical and market analysis. You will decide where to place your bet—on improving the old or backing the new—and justify it with the quantitative rigor we've developed throughout this course.