Recommended resources
The freely available resources this lesson will direct you to.
Welcome back. Last lesson, you sorted and filtered spending records to find budget overruns. Those tools show you what is in a spreadsheet, but they cannot tell you whether every record is trustworthy. A duplicated expense could inflate a total; a misspelled department could split one department into two groups.
In this lesson, you’ll inspect a small finance spreadsheet for missing values, duplicates, inconsistent labels, and invalid values. The aim is to identify and document problems before deciding how to correct them. Allow about 35–40 minutes, including time in Excel.
Start with a copy and a clear expectation
Keep your earlier workbook unchanged. On a new worksheet named Quality_Check, enter the following raw records in columns A:E. The first four match the records you inspected last lesson; the additional rows are deliberately questionable. Leave E7 genuinely empty—do not type the word “blank.”
| Row | department | month | record_id | actual_inr | budget_inr |
|---|---|---|---|---|---|
| 2 | Finance | Jan | R01 | 110 | 100 |
| 3 | Operations | Jan | R02 | 95 | 105 |
| 4 | Operations | Feb | R03 | 75 | 80 |
| 5 | Finance | Feb | R04 | 88 | 80 |
| 6 | Finance | Feb | R04 | 88 | 80 |
| 7 | Operations | Mar | R05 | 60 | |
| 8 | Finanace | Mar | R06 | 70 | 80 |
| 9 | Finance | Apr | R07 | -25 | 90 |
For this inspection, suppose each record_id should identify one spending record, every record needs a budget for budget-versus-actual analysis, and the permitted departments are Finance and Operations. Also suppose actual_inr records gross spending, so it cannot be negative; refunds are recorded separately. These expectations matter: a value is not invalid merely because it looks unusual.
Read the opening of Eval Academy’s The Data Cleaning Toolbox to see how a column’s filter list exposes unexpected entries, then its discussion of missing data and numerical placeholders.
The Data Cleaning Toolbox - Eval Academy
Eval Academy explains why inspecting values should come before cleaning them, and why a blank differs from a number used to stand for “missing.”
In “Identify the Problem,” read the opening explanation, from the paragraph beginning “Before data cleaning” through the sentence about the filter’s list of unique values. Then, in “Missing data,” read the opening discussion, from the first paragraph through the question about whether a blank reflects a data-entry error. In “Tips for handling missing data,” find the bullet beginning “Avoid using numerical placeholders where possible” and read its example. Focus on why a number such as 99 cannot be declared missing without knowing the dataset’s rules.
Find missing values without inventing them
Select E2:E9 in your practice sheet. In desktop Excel, choose Home > Find & Select > Go To Special > Blanks > OK. Excel should select E7, the missing budget for R05. If you use the budget column’s filter dropdown instead, you can also look for (Blanks) in its list of values.
Watch how MyOnlineTrainingHub locates blanks in How to Clean Data in Excel in 10 Minutes (Free File). The presenter demonstrates ways to fill them, but do not copy a value from the row above into E7: R04’s budget gives us no evidence of R05’s budget.
How to Clean Data in Excel in 10 Minutes (Free File)
MyOnlineTrainingHub demonstrates a quick way to select blank cells. Watch for the selection technique, not as a recommendation to fill this budget without evidence.
Watch finding blanks, beginning when the presenter selects the region column and opens Go To Special. Stop at the end of the blank-cell demonstration. Notice the difference between locating a blank and choosing a defensible value for it.
A blank cell is not the only possible sign of missing information. Someone might type N/A or use a numerical code. Inspect the actual values in a column before treating such entries as ordinary amounts. Conversely, zero can be a real amount; do not replace every zero with a blank. In this example, record R05 has a missing budget, so its budget variance cannot yet be trusted.
Check duplicates at the right level
Now select C2:C9, including the record IDs but not the header. Choose Home > Conditional Formatting > Highlight Cells Rules > Duplicate Values. Excel should highlight both occurrences of R04, in rows 5 and 6. Inspect the entire rows: here, department, month, actual, and budget match too.
The distinction matters. A repeated department is normal; many records can belong to Finance. A repeated record_id is suspicious because we stated that this field should be unique. Even two identical rows deserve investigation before deletion: they could be a double entry, or the record system could have assigned an ID incorrectly.
Watch the duplicate-identification portion of the same MyOnlineTrainingHub video. It also shows Remove Duplicates, which changes the data; for now, use highlighting to inspect rather than removing a row.
How to Clean Data in Excel in 10 Minutes (Free File)
Return to How to Clean Data in Excel in 10 Minutes (Free File) for its demonstration of highlighting repeated IDs. Pay attention to how the columns selected for a duplicate check determine what “duplicate” means.
Watch spotting duplicates, from the introduction of duplicate entries through the Remove Duplicates demonstration. For our sheet, the highlighted IDs identify records to review; do not run the removal step on your only copy.
If you later use Data > Remove Duplicates, selecting only record_id treats every repeated ID as a match, while selecting all columns looks for identical rows. Neither choice establishes why the repetition occurred. Keep the original records until you can confirm which one, if either, should be excluded from analysis.
Look for labels that split a category
Open the filter dropdown for department. Its value list should include Finance, Finanace, and Operations. Last lesson, you used a filter to narrow records by business condition; here, the same control helps you inspect the vocabulary of a column. Filter to Finanace to locate R06, then clear the filter to restore the full view.
Because our permitted-department list contains Finance and Operations, Finanace is a likely typo for Finance. Without that list—or confirmation from the source—we should describe it as a suspected mismatch, not quietly rewrite the record. Also watch for labels with extra spaces or alternative names; they can make categories harder to compare even when they look similar on screen.
Eval Academy’s section on inconsistent data explains why spelling and naming differences are worth finding before summaries are produced.
The Data Cleaning Toolbox - Eval Academy
Continue in Eval Academy’s toolbox to connect inconsistent labels with the filter inspection you just performed.
In “Inconsistent data,” read the opening paragraph, from its first sentence through the examples of differing names. Then find “Method 3: Sort, Filter, and Correct” and read the filter method, from its opening sentence through the warning to make accurate edits. Focus on identifying the variant; standardizing text systematically comes later in the course.
Test numbers against a stated rule
Sort actual_inr from smallest to largest, keeping complete rows together. R07’s -25 should stand out. You can also use the MIN summary function from an earlier lesson to confirm that the column’s lowest value is -25. Neither a sort nor a minimum proves an error by itself: a negative amount might represent a refund in another dataset. It conflicts with this sheet’s stated gross-spending rule, so mark it for investigation.
Read the invalid-data and range-check passages in Eval Academy’s toolbox before using an Excel rule. They emphasize that validity depends on what values the field is supposed to allow.
The Data Cleaning Toolbox - Eval Academy
This final selection from Eval Academy’s toolbox explains why acceptable ranges must come from the meaning of a field, not merely from the numbers observed in it.
In “Invalid data,” read the range example, from the sentence about knowing acceptable values through the example of values outside a permitted scale. Then, under “Method 1: Check Data Ranges,” read the checking method, from its first sentence through detecting values outside the expected range.
Excel can mark existing entries that break a validation rule. Select D2:D9, then choose Data > Data Validation. Set Allow to Whole number, Data to greater than or equal to, and Minimum to 0. After confirming the rule, return to the Data Validation dropdown and choose Circle Invalid Data.
Watch the sequence in IvyProSchool’s How to identify Inconsistent data using Excel? It demonstrates setting a numerical rule and then circling values that fail it.
How to identify Inconsistent data using Excel? | Data Cleaning using Excel Ep 5 | IvyProSchool
IvyProSchool shows how a defined numerical range can reveal entries already present in a sheet. Its salary limits are only an example; use our gross-spending rule for the practice data.
Watch validation circles, from setting criteria through circling invalid entries and clearing the circles. Focus on the order: establish the rule first, then ask Excel to circle violations.
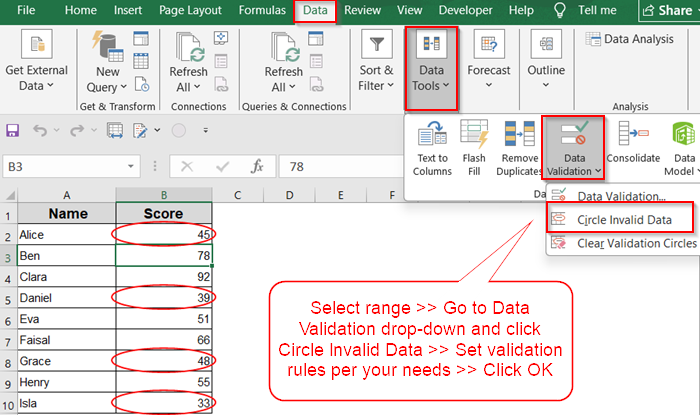
In your practice sheet, D9 should be flagged under the nonnegative whole-number rule. A circle identifies a rule violation; it does not explain its cause or correct the value. It also will not find the duplicated ID or misspelled department, and the budget rule would need a separate check. If a value is a legitimate refund, the appropriate response is to revisit the field definition or rule—not force the amount to zero.
Record findings before changing records
At this point, you should have an inspection log like this. It separates what you observed from what you still need to verify.
| Record | Observed issue | Follow-up |
|---|---|---|
| R05 | budget_inr is blank |
Obtain the budget or report that its variance is unavailable. |
| R04 | ID and complete record appear twice | Check the source before excluding either row. |
| R06 | Finanace is outside the permitted department labels |
Confirm whether Finance was intended. |
| R07 | actual_inr is -25 under a nonnegative gross-spending rule |
Check whether it is an error or a separately recorded refund. |
Keep this log alongside an untouched copy of the data. If you later make a correction, note its source and check the affected summary again. This is especially important for budget analysis: filling R05’s budget by guesswork, counting R04 twice, or grouping R06 separately could each change the business finding.
Takeaway
You can now use blank selection, duplicate highlighting, filter value lists, numerical summaries, and validation rules to locate four common data-quality problems. The governing habit is to define what a field should contain, identify departures from that expectation, and investigate before editing or deleting records.
This completes the spreadsheet-foundations module. Next, you’ll build conditional calculations with IF and logical tests—tools that become much more useful when you know which inputs need scrutiny.