Recommended resources
The freely available resources this lesson will direct you to.
Welcome back. Last lesson, you classified fields by what they mean: identifiers distinguish records, categories define groups, numbers measure quantities, and dates locate events in time. Now you’ll use that understanding to restructure a small dataset. The aim is a table where each row describes one observation and each column holds one variable—a layout that makes the finance comparisons you framed earlier easier to carry out. Allow about 35–40 minutes for the lesson and worked example.
Decide what one row means
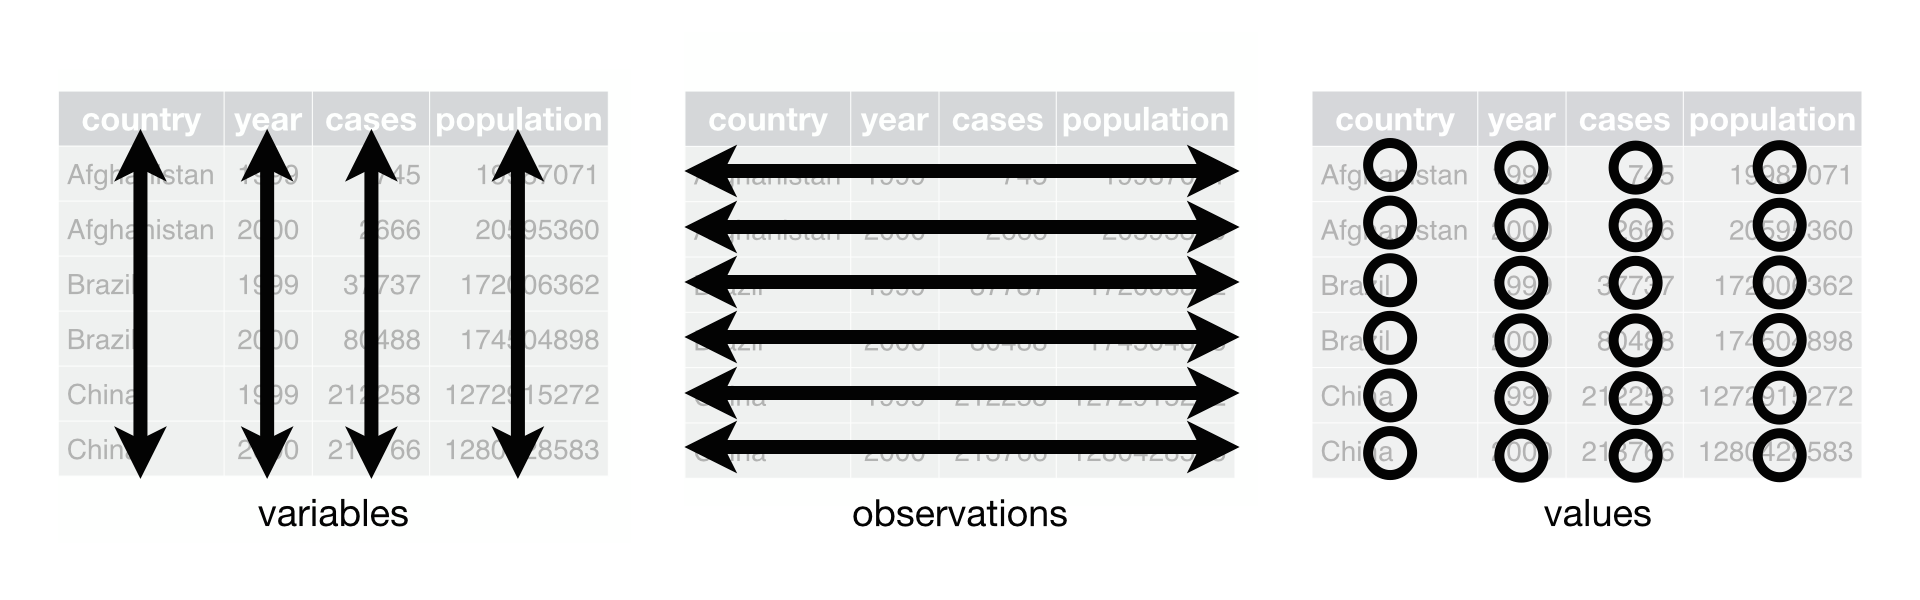
A tidy table has a simple organizing rule: one observation per row, one variable per column, and one value per cell. An observation is not necessarily a person or a transaction. It might be one department in one month. Before moving any cells, finish this sentence: “Each row will describe one ______.”
Watch the opening of Tidy data by Equitable Equations for the rule, then skip to its example of a table whose category labels have been spread across both rows and columns.
“Tidy data” introduces the row-and-column rule and shows why a table that looks compact to a reader may need a different structure for analysis.
Watch the three rules for the definitions of observation and variable. Then skip to the loan table; notice how its borrower and housing categories become column values in the reorganized table.
A heading such as January actual contains more than a variable name. It encodes both a month and a kind of amount. If the next headings are February actual and March actual, you are adding a new column each time a month arrives. For an analysis whose observations are monthly records, month belongs in a column as a value, not solely inside headings.
This is a choice about the level of detail of a row, sometimes called its grain. An expense transaction table could have one row per transaction; a monthly reporting table could have one row per department-month. Both can be well structured, but a row must not silently switch between those meanings.
Turn month headings into month values
Suppose a business supplies this small 2025 report. All amounts are in rupees. The headings make it convenient to scan across a department, but our intended observation is one department in one month.
| Department | Jan actual | Jan budget | Feb actual | Feb budget |
|---|---|---|---|---|
| Sales | 110 | 100 | 95 | 105 |
| Operations | 75 | 80 | 88 | 80 |
There are two departments and two months, so the restructured table needs four observations. Keep actual_inr and budget_inr as separate columns: they are two distinct measures for the same department-month. Move the month information out of the headings into a month column.
| department | month | actual_inr | budget_inr |
|---|---|---|---|
| Sales | 2025-01 | 110 | 100 |
| Sales | 2025-02 | 95 | 105 |
| Operations | 2025-01 | 75 | 80 |
| Operations | 2025-02 | 88 | 80 |
To make this change in a spreadsheet, preserve the original sheet and build a new table with one header row. For each source department, create a January row and a February row. Repeat the department name in both rows; enter the month in its own cell; then place that month’s actual and budget amounts in their corresponding columns. Keep the amount cells numeric rather than typing INR into each one. The column names document their units.
Repeating Sales is intentional, not a duplicate-record error: the two Sales rows describe different months. In this example, department together with month identifies an observation. A second Sales row for January would need investigation—unless the table’s intended grain included another distinction, such as cost centre.
The following image shows the same shape-changing idea with repeated readings rather than months: labels that were separate headings become values in a new column.
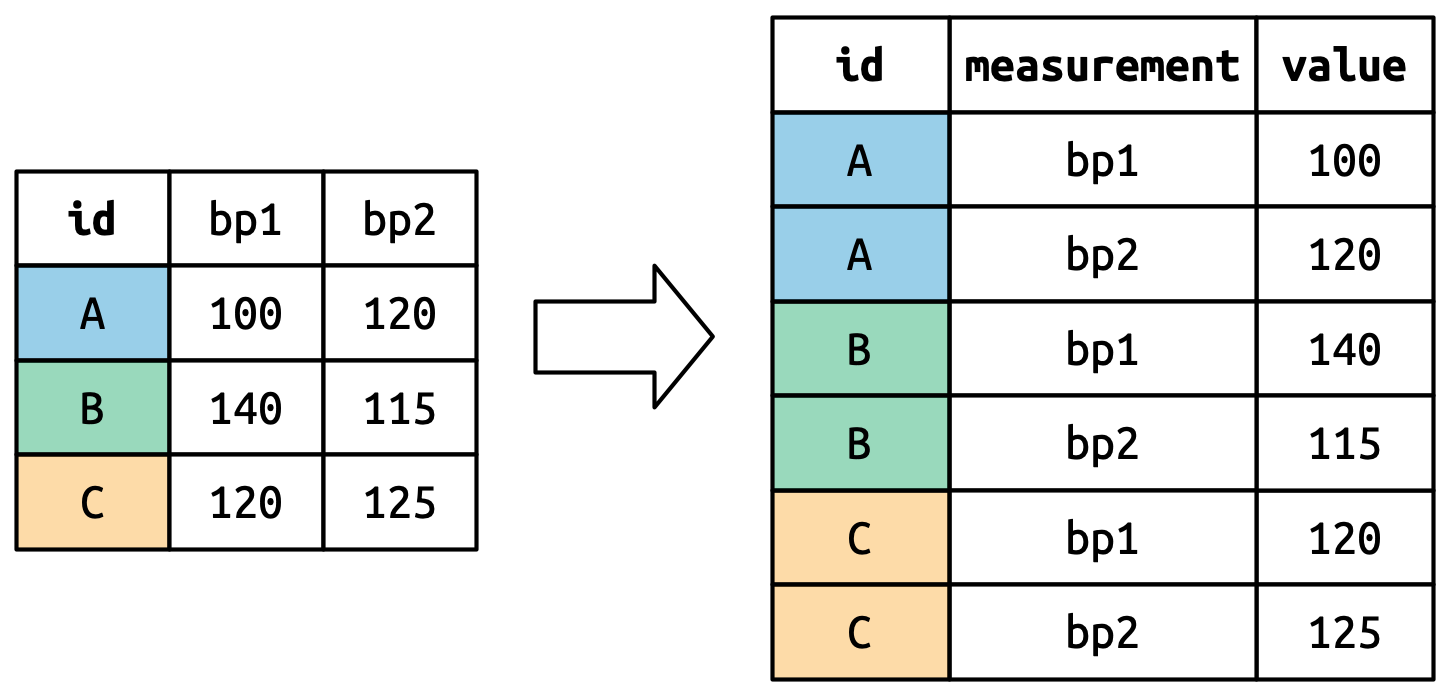
There is an important distinction between that image and our report. bp1 and bp2 are presented as repeated readings of one measure, so a measurement column distinguishes them. Our actual and budget amounts are different measures of the same department-month, so keeping two amount columns is useful. “One variable per column” does not mean forcing every number into a single column.
Check that the restructuring preserved the data
Restructuring should change the arrangement, not invent or discard amounts. For this report, a quick check gives four data rows, one for each department-month. The actual amounts still total 368 rupees, and the budgets still total 365 rupees. Those totals alone cannot prove every amount is in the right place, so also trace a few pairs back to the source: Sales in January must still have actual 110 and budget 100; Operations in February must still have actual 88 and budget 80.
The Ohio State University Center for Biostatistics shows a similar conversion where the same subject is measured more than once. Although its example is clinical, the reason for repeating an ID across observation rows is the same reason we repeated a department above.
Excel Spreadsheet Data Entry Tips
Read the “Multiple Observations Per Subject” example to see how an identifier and other unchanged details stay attached to every measurement row.
Find Section 8, “Multiple Observations Per Subject,” on p. 6 and the accompanying before-and-after illustration continuing onto p. 7. Read the example. Focus on why the week moves from separate column headings into a Week column, while the subject ID is repeated for each week.
One boundary matters for finance work: do not combine unlike observations just because they share a label. If the actual amounts came from individual expense transactions but the budget were one total for the whole department-month, copying that full budget onto every transaction row would repeat the budget and inflate a later total. The table above works because both actual and budget are already defined at the department-month level. When they are not, first decide what each row should represent and which amounts belong at that level.
Takeaway
To restructure a table, first state what one row represents. Then give each variable a column, turn information hidden in headings into values where appropriate, and repeat identifying fields so every row remains understandable on its own. Finally, check row counts, key value pairs, and totals against the untouched source. A tidy layout does not guarantee that the data is correct, but it gives you a dependable structure for checking and analysing it.
Next, you’ll import a CSV file into Excel and verify that its fields arrived in the intended columns and formats.