Recommended resources
The freely available resources this lesson will direct you to.
- A Critical Skill People Learn Too LATE: Learning Curves In Machine Learning.www.youtube.com
- 154 - Understanding the training and validation loss curveswww.youtube.com
- Overfitting: Interpreting loss curves | Machine Learningdevelopers.google.com
- Training and Validation Loss in Deep Learningwww.geeksforgeeks.org
Hello! Welcome to our next lesson.
Introduction
In our last lesson, we explored learning rate scheduling, a technique to dynamically adjust the learning rate during training for faster convergence and better performance. But how do we know if these adjustments—or any of our model design choices—are actually working? How do we diagnose a model that is "learning" but not improving?
The answer lies in monitoring the model's performance not just on the data it trains on, but also on data it has never seen. This lesson is dedicated to a fundamental skill for any AI engineer: interpreting training and validation loss curves to diagnose model behavior.
Our learning outcome is to identify overfitting by analyzing training and validation loss curves. We will learn what these curves represent, how to spot the classic signs of a model that is failing to generalize, and how this contrasts with a well-behaved model.
1. Training Loss vs. Validation Loss
Before we can interpret the curves, we need to be crystal clear on what they represent. During training, we typically split our data into at least two sets:
- Training Set: The data the model learns from. The model's parameters (weights and biases) are adjusted based on its performance on this data.
- Validation Set: A separate portion of data that is not used for training. We use it to evaluate the model's performance on unseen data at the end of each epoch.
This leads to two corresponding loss metrics:
- Training Loss: The error of the model on the training set. A low training loss indicates the model has successfully fit the training data.
- Validation Loss: The error of the model on the validation set. A low validation loss indicates the model is able to generalize to new, unseen data.
Training and Validation Loss in Deep Learning
This article from GeeksforGeeks provides clear, concise definitions of training and validation loss and explains why monitoring both is crucial.
Please read the sections 'Training Loss,' 'Validation Loss,' and 'Importance of Monitoring Both Losses.' This will solidify the definitions and purpose of each metric.
The core idea is that while we want our model to fit the training data well, our ultimate goal is for it to perform well on data it hasn't seen before. The validation loss is our proxy for this "real-world" performance.
2. The Three Scenarios: Underfitting, Overfitting, and a Good Fit
By plotting the training and validation loss over epochs, we can diagnose how our model is learning. Let's build our intuition with a great introductory video.
A Critical Skill People Learn Too LATE: Learning Curves In Machine Learning.
The 'Underfitted' channel provides a fantastic analogy to understand learning curves. It compares a model to a student preparing for an exam, which makes the concepts of learning, generalization, and memorization very intuitive.
Watch from the beginning to 04:38. Pay close attention to how the video visually represents: Underfitting: A high training loss. Overfitting: A low training loss but a high testing (validation) loss. A Good Fit: Both training and testing losses are low and converging.
As the video illustrates, we are looking for a "sweet spot." We want a model that is complex enough to learn the patterns in the data, but not so complex that it starts memorizing the noise.
3. Identifying Overfitting: The Key Pattern
Let's focus on our main learning outcome. Overfitting is one of the most common failure modes in deep learning. Its signature on a loss curve plot is unmistakable:
- The training loss consistently decreases.
- The validation loss decreases for a period, reaches a minimum, and then starts to increase.
This divergence is the critical signal. It tells us the model is no longer learning generalizable patterns. Instead, it has started to memorize the specific examples in the training set, including their noise and irrelevant details. Its performance on the training data continues to improve, but its performance on new data (the validation set) gets worse.
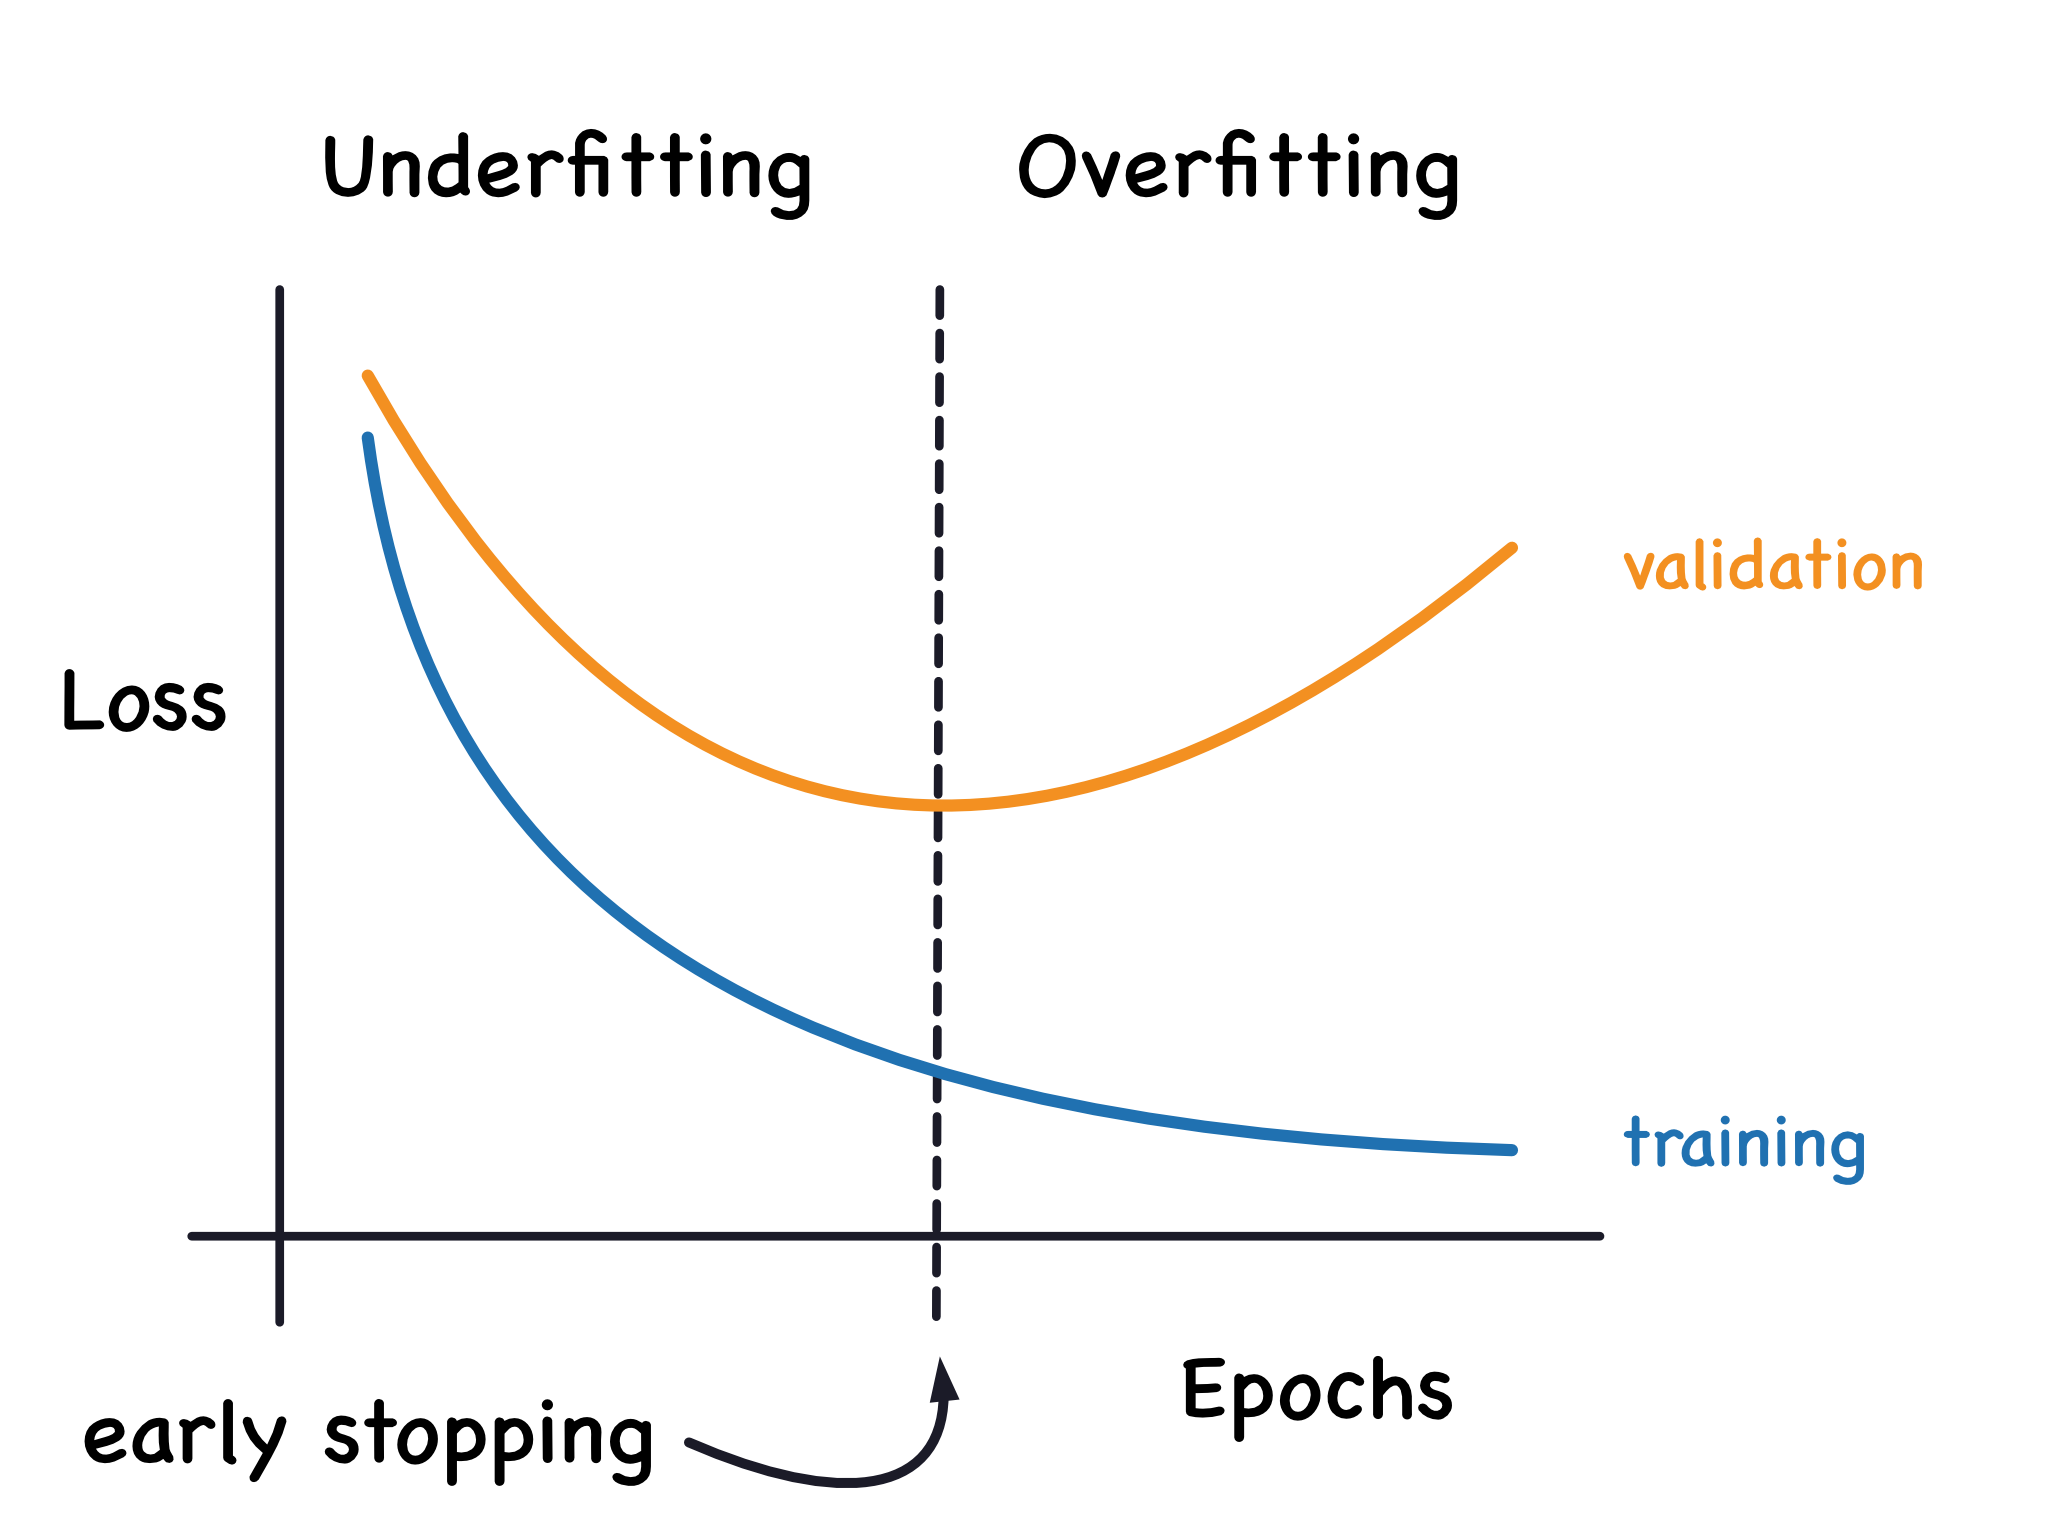
Let's check your understanding with a quick exercise from Google's Machine Learning Crash Course.
Overfitting: Interpreting loss curves | Machine Learning
This page presents several loss curve puzzles. Focus on the one that directly addresses overfitting.
Scroll down to 'Exercise 3. Test loss diverges from training loss.' Look at the plot and read the question. The correct answer and its explanation confirm the classic sign of overfitting.
4. A Practical Demonstration: From Good Fit to Overfitting
So far, we've seen idealized examples. Let's now watch a practical demonstration of how overfitting emerges as we increase a model's complexity. In this video, the presenter trains several models on the same dataset, starting with a simple one and progressively making them more complex.
154 - Understanding the training and validation loss curves
In this video by DigitalSreeni, you'll see how the loss curves change as the neural network architecture becomes more complex, leading to clear overfitting.
Please watch these two key segments: Demonstrating Overfitting (16:35 - 21:19): The presenter moves from a simple model to more complex ones (more layers, more neurons). Observe how the validation loss begins to diverge and increase as the model becomes 'too complicated for the problem.' This is a classic, real-world example of overfitting. Summary of Patterns (23:20 - 27:11): This is a great recap that shows various loss curve patterns, including overfitting, underfitting, and a good fit, summarizing everything we've discussed.
This practical example is powerful because it shows a direct cause-and-effect relationship: increasing model capacity (making it "smarter") without any safeguards can easily lead to the model memorizing the training data instead of learning from it.
Conclusion
Congratulations! You've just learned one of the most fundamental diagnostic skills in machine learning. By simply plotting and observing two curves, you can gain deep insights into your model's behavior.
Key Takeaways:
- Loss curves are vital diagnostic tools. They plot training loss and validation loss against training epochs.
- A "Good Fit" is characterized by both training and validation loss decreasing and converging to a low value.
- Underfitting occurs when the model is too simple. Both training and validation loss remain high.
- Overfitting is the key problem we focused on today. It occurs when the model is too complex and starts to memorize the training data. Its signature is a diverging validation loss curve, which starts to increase while the training loss continues to decrease.
In this lesson, we learned how to identify overfitting. In our next lessons, we'll focus on how to fix it. We will explore powerful regularization techniques like L2 regularization and dropout, which are designed specifically to combat overfitting and improve your model's ability to generalize.