Hello! Welcome back to our journey in building a high-performance telemetry engine.
In our last lesson, you successfully brought our static plot to life by implementing cursor-centered zooming. You introduced the crucial state variables pan_offset and zoom_level and created the WorldToScreen and ScreenToWorld transformation functions. This was a major step in making our visualization interactive.
Today, we will complete the core navigation functionality by implementing panning. You will learn how to "grab" the plot with the mouse and drag it around. This is achieved by capturing mouse movement and using it to update the pan_offset you created in the last lesson. By the end of this lesson, you will have a fully navigable, infinite 2D canvas—the foundation for our advanced plotter.
The Core Concept: Translating the World
Panning is a translation transformation. In computer graphics, this means shifting the position of every point in a coordinate system by a fixed amount.
In our plotter, the pan_offset variable represents the "world-space" coordinate that is mapped to the top-left corner of our visible canvas. To pan the view, we simply need to change this offset.
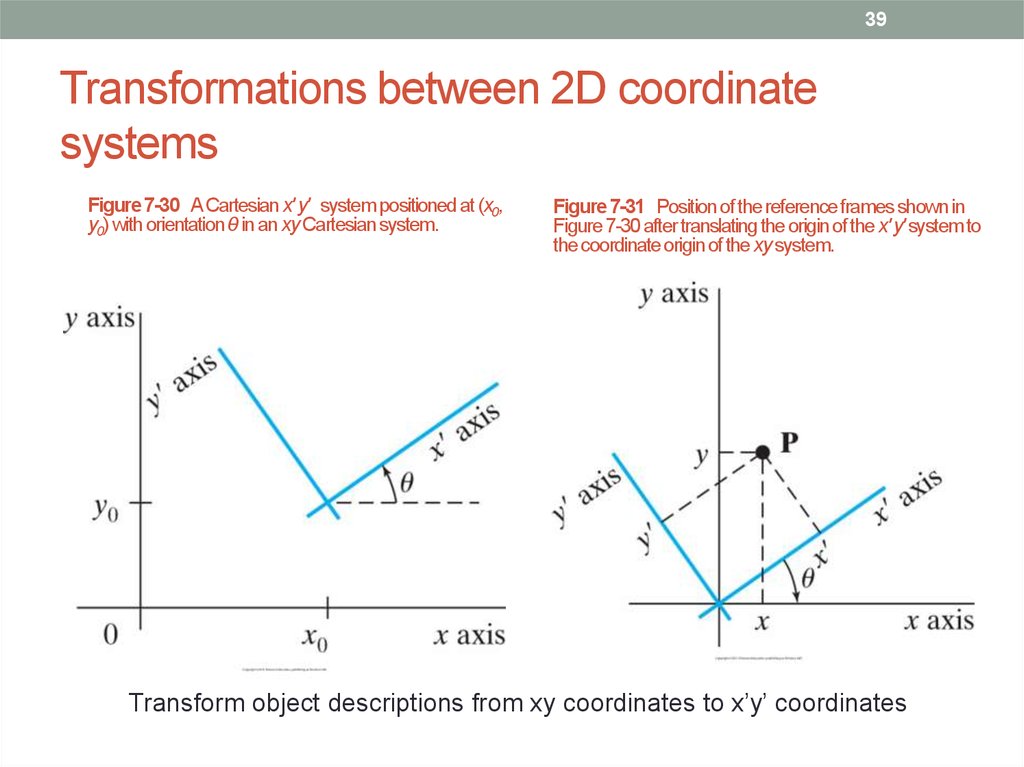
The process is straightforward:
- Detect when the user is dragging the mouse across the plot.
- Get the distance the mouse has moved since the last frame. This is called the mouse delta and is given in screen-space pixels.
- Crucially, convert this screen-space delta into a world-space delta. A 10-pixel movement on screen corresponds to a different distance in our data depending on the current zoom level.
- Update
pan_offsetwith this calculated world-space delta.
Let's watch a short segment of the video we saw last time, now focusing specifically on the logic behind panning.
This clip from javidx9 explains the fundamental relationship between world space, screen space, and the offset that enables panning. It clearly visualizes the simple subtraction that forms the core of our transformation functions.
Watch the section from 02:04 to 04:17. The key formula presented is ScreenX = WorldX - OffsetX. This directly relates to our WorldToScreen function, where pan_offset is the offset.
From Theory to Code: Implementing Panning
The video establishes the concept. Now, how do we implement the interactive part? We need to handle the mouse input and perform the correct calculation to update our pan_offset.
The most important step is converting the mouse delta from screen space to world space. Since our zoom_level represents "pixels per world unit," the conversion is a simple division:
world_space_delta = screen_space_delta / zoom_level
This ensures that the panning speed feels consistent regardless of how zoomed in or out you are. Let's look at a clean, practical implementation of this.
Implementation of pan and zoom on a 2D canvas
This C++ code gist provides a clear and concise implementation of both pan and zoom logic. We will focus on the panning part, which demonstrates exactly how to calculate and apply the offset.
Read the section titled 'Panning Implementation'. Focus on the OnPanMove function. Notice the key line: const Vector2f offset = (mouse_screen_space - selection.pan_start) / selection.canvas.scale;. This is the screen-to-world delta conversion we just discussed. The next line, selection.canvas.position = selection.canvas.position - offset;, applies this to the canvas's main offset.
Notice the code subtracts the offset: canvas.position = canvas.position - offset. This might seem counter-intuitive at first, but it's correct. If you drag your mouse to the right (a positive X delta), you want the data to appear to move to the left. To achieve this, you must shift your view's origin (the pan_offset) to the right, which means subtracting the negative world-space delta from your view's position. However, a simpler way to think about it is that you are moving the world in the opposite direction of the mouse drag. Drag right, world moves left.
Integrating Panning into our ImGui Plot
Now let's add this logic to our PlotMyData function. We can place it right alongside the zoom handling code from the previous lesson. ImGui makes this very convenient with ImGui::IsMouseDragging and ImGui::GetIO().MouseDelta.
Here is the updated section of the PlotMyData function:
// ... inside PlotMyData(), after the InvisibleButton ...

    const bool is_hovered = ImGui::IsItemHovered(); // Is the mouse over our canvas?
    const bool is_active = ImGui::IsItemActive();   // Is the user interacting with our canvas (e.g., clicking/dragging)?

    // 2. Handle Zooming
    if (is_hovered && ImGui::GetIO().MouseWheel != 0)
    {
        // ... same zoom code as the previous lesson ...
        ImVec2 mouse_pos_screen = ImGui::GetMousePos();
        ImVec2 mouse_pos_world_before = ScreenToWorld(mouse_pos_screen, pan_offset, zoom_level, canvas_p1, canvas_p2);

        float zoom_delta = ImGui::GetIO().MouseWheel * 0.1f;
        zoom_level *= std::pow(2.0f, zoom_delta);
        zoom_level = std::clamp(zoom_level, 1.0f, 1000.0f);

        ImVec2 mouse_pos_world_after = ScreenToWorld(mouse_pos_screen, pan_offset, zoom_level, canvas_p1, canvas_p2);

        pan_offset.x += mouse_pos_world_before.x - mouse_pos_world_after.x;
        pan_offset.y += mouse_pos_world_before.y - mouse_pos_world_after.y;
    }

    // 3. Handle Panning (NEW CODE)
    if (is_active && ImGui::IsMouseDragging(ImGuiMouseButton_Left))
    {
        // Get mouse delta in screen space
        ImVec2 mouse_delta = ImGui::GetIO().MouseDelta;

        // Convert screen-space delta to world-space delta
        // Note: We negate the delta to move the world in the opposite direction of the mouse
        // We also flip the Y-axis because ImGui's screen coordinates have Y pointing down.
        pan_offset.x -= mouse_delta.x / zoom_level;
        pan_offset.y += mouse_delta.y / zoom_level;
    }

    // 4. Draw the grid/data
    // ... rest of the drawing code is the same ...
The InvisibleButton you added in the previous lesson already sets the stage for this. ImGui::IsMouseDragging(ImGuiMouseButton_Left) will only be true if the user started dragging with the left mouse button while the cursor was over that invisible button, which is exactly the behavior we want.
Test your understanding!
You've implemented panning. Now, what would happen if you forgot to divide ImGui::GetIO().MouseDelta by zoom_level before updating pan_offset? Describe the user experience at high and low zoom levels.
Show answer
If you forgot to divide by zoom_level, the panning speed would be tied to pixels, not data units. The interaction would feel broken and uncontrollable:
- When zoomed far out (low
zoom_level): A small mouse drag (e.g., 100 pixels) would cause the view to fly across a huge distance in world space, as those 100 pixels might represent thousands of data points. It would be almost impossible to make fine adjustments. - When zoomed far in (high
zoom_level): A large mouse drag across the entire screen would barely move the view, because each pixel represents a tiny fraction of a data unit. Panning would feel sluggish and unresponsive.
Scaling the delta by the zoom_level is what makes the panning feel consistent and as if you are "grabbing" the data itself.
Conclusion
Excellent work! You have now implemented the two fundamental navigation tools for any 2D data visualization: zoom and pan. Your plotter is no longer a static image but a truly interactive canvas where you can freely explore a virtual data space.
Key Takeaways:
- Panning is a translation of the view, implemented by modifying the world-space
pan_offset. - Mouse movement is reported by ImGui in screen space (pixels) via
ImGui::GetIO().MouseDelta. - To correctly pan, you must convert the screen-space mouse delta into a world-space delta by dividing by the current
zoom_level. - The logic for panning fits neatly alongside the zoom logic, with both manipulating the
pan_offsetandzoom_levelstate variables to control the view.
What's Next?
We now have a fully navigable, infinite canvas. But without context, it's just a scrolling, scaling line. To make it a truly useful analysis tool, we need reference points.
In the next lesson, we will begin rendering basic axes and labels for our custom plot. These elements will need to adapt dynamically to the current pan and zoom state, providing the crucial context needed to understand the data being displayed. This will mark the transition from a simple drawing canvas to a recognizable and functional plotter.