Hello! Welcome to the first lesson in our module on building custom visualizations.
In our last session, we refactored our application into a clean, scalable structure using classes and even explored the zero-cost abstraction of CRTP. We now have a solid MyApp class with an update() method, which is the perfect place to start building our user interface.
Today, we're taking our first concrete step toward building the "LOD Plotter." Before we dive into the complexities of custom rendering and data decimation, we'll start with a powerful tool already in our arsenal: ImGui's built-in PlotLines widget. This will allow us to get time-series data onto the screen quickly, understand the fundamentals of plotting, and create a "live" graph that updates in real-time.
This lesson directly addresses our goal of visualizing variables like FPS or physics jitter. While PlotLines isn't the final high-performance solution, mastering it provides a crucial baseline and a rapid way to prototype our visualizer.
Introducing ImGui::PlotLines
ImGui::PlotLines is a simple yet flexible widget that renders a line graph from a series of data points. It's perfect for displaying dozens or even hundreds of values, but as we'll discuss later, it has performance limitations that our final LOD Plotter will be designed to overcome.
There are two primary ways to provide data to PlotLines, and we'll cover both:
- Directly from an array of
floats. - Using a "getter" function that ImGui calls to retrieve each data point on the fly.
Method 1: Plotting from a Data Array
The most straightforward way to use PlotLines is by passing it a pointer to an array of floating-point values. This is ideal when you have a set of data already collected in memory, which is exactly the scenario for our telemetry engine.
Quick GUI for MBED projects using Dear ImGui and Serial
Let's look at a simple, practical example. This blog post demonstrates how to plot data stored in a C-style array.
Read the short section that begins with 'To create a graph the following code is used:'. Pay close attention to the ImGui::PlotLines function call and the explanation of its parameters.
As you saw in the resource, the usage is very simple. Here's a typical example you might place inside your MyApp::update() method:
void MyApp::update()
{
    ImGui::Begin("My Plot");

    // Static array to hold our data points.
    // 'static' ensures the data persists between frames.
    static float values[100] = { /* some data */ };

    // A simple loop to fill the array with a sine wave
    for (int i = 0; i < 100; i++)
    {
        values[i] = sinf( (float)i * 0.1f + (float)glfwGetTime() );
    }

    ImGui::PlotLines(
        "Sine Wave",          // A label for the plot
        values,               // Pointer to the data
        IM_ARRAYSIZE(values), // Number of values in the array
        0,                    // An offset into the data array
        nullptr,              // Overlay text (we'll ignore this)
        -1.1f,                // The minimum value on the Y-axis
        1.1f,                 // The maximum value on the Y-axis
        ImVec2(0, 150.0f)     // The size of the graph
    );

    ImGui::End();
}
In this example, we regenerate the data every frame to create an animation. The most important parameters are the label, the pointer to the values, and the number of values. The scale_min and scale_max parameters are crucial for keeping the Y-axis stable; otherwise, ImGui will auto-scale it each frame, causing the graph to jump around.
Method 2: Plotting with a Getter Function
What if your data isn't in a simple float array? Or what if you want to plot a mathematical function without pre-calculating all the points? For this, ImGui::PlotLines provides a powerful overload that accepts a function pointer or a C++ lambda.
ImGui will call your function for each point it needs to draw (from idx = 0 to values_count - 1), and your function is responsible for returning the Y-value for that point.
Plotting math functions (quadratic funct - C++ Forum
This forum post provides an excellent breakdown of the getter function approach. It shows how to use a lambda to generate plot data on the fly.
Skim through the examples in the post. Notice the two main signatures for PlotLines (one taking a const float* and one a values_getter). Focus on the lambda function [](void* data, int idx) { ... } and how it is used to return a value based on the index idx.
The signature for the getter function is float(void* data, int idx).
int idx: The index of the data point ImGui wants (e.g., from 0 to 99).void* data: A "user data" pointer that you can pass toPlotLines. This is incredibly useful for giving your getter function context.
Here's how you could plot a quadratic function without storing any data in an array:
ImGui::PlotLines(
    "Quadratic",
    // This lambda is our getter function
    [](void* data, int idx) {
        // We can ignore 'data' for this simple example
        float x = (idx - 50) * 0.1f; // Map index 0-99 to x range -5.0 to 4.9
        return x * x;
    },
    nullptr,      // We don't have any user data to pass
    100,          // We want to plot 100 points
    0,
    nullptr,
    -1.0f,
    25.0f,
    ImVec2(0, 150.0f)
);
This approach is very memory-efficient when the data can be calculated algorithmically.
Test your understanding!
You have data stored in a std::vector<double>. The PlotLines function expects float values. How could you use the getter-based PlotLines overload to plot the data from your vector without creating a separate std::vector<float>?
Show answer
You would pass a pointer to your std::vector<double> as the void* data argument. Inside the lambda, you would static_cast the void* back to a std::vector<double>* and return the correctly indexed value, cast to a float.
static std::vector<double> my_data = { /* ... lots of doubles ... */ };

ImGui::PlotLines(
    "My Doubles",
    [](void* data, int idx) {
        // Cast the void pointer back to its real type
        auto* vec = static_cast<std::vector<double>*>(data);
        // Access the element and cast to float for ImGui
        return (float)((*vec)[idx]);
    },
    &my_data, // Pass the address of the vector as user data
    my_data.size(),
    0,
    nullptr,
    -1.0f, 1.0f,
    ImVec2(0, 150)
);
This is a powerful and efficient pattern that avoids data duplication.
Simulating a Real-Time Data Feed
Our telemetry engine won't have static data; it will receive a constant stream of new measurements. We need our plot to update and scroll as new data arrives. We can simulate this by using a fixed-size array as a circular buffer.
Here's the logic:
- Store your data points in an array (or
std::vector). - Maintain an index that points to the next slot to write to.
- When a new data point arrives, write it to the current index and increment the index, wrapping around to 0 if you reach the end of the array.
- Use the
values_offsetparameter ofImGui::PlotLinesto tell it where the "start" of your data is. By setting this to our current write index, the plot will automatically scroll, always showing the most recent data.
This effect creates a scrolling graph, often seen in performance monitoring tools.
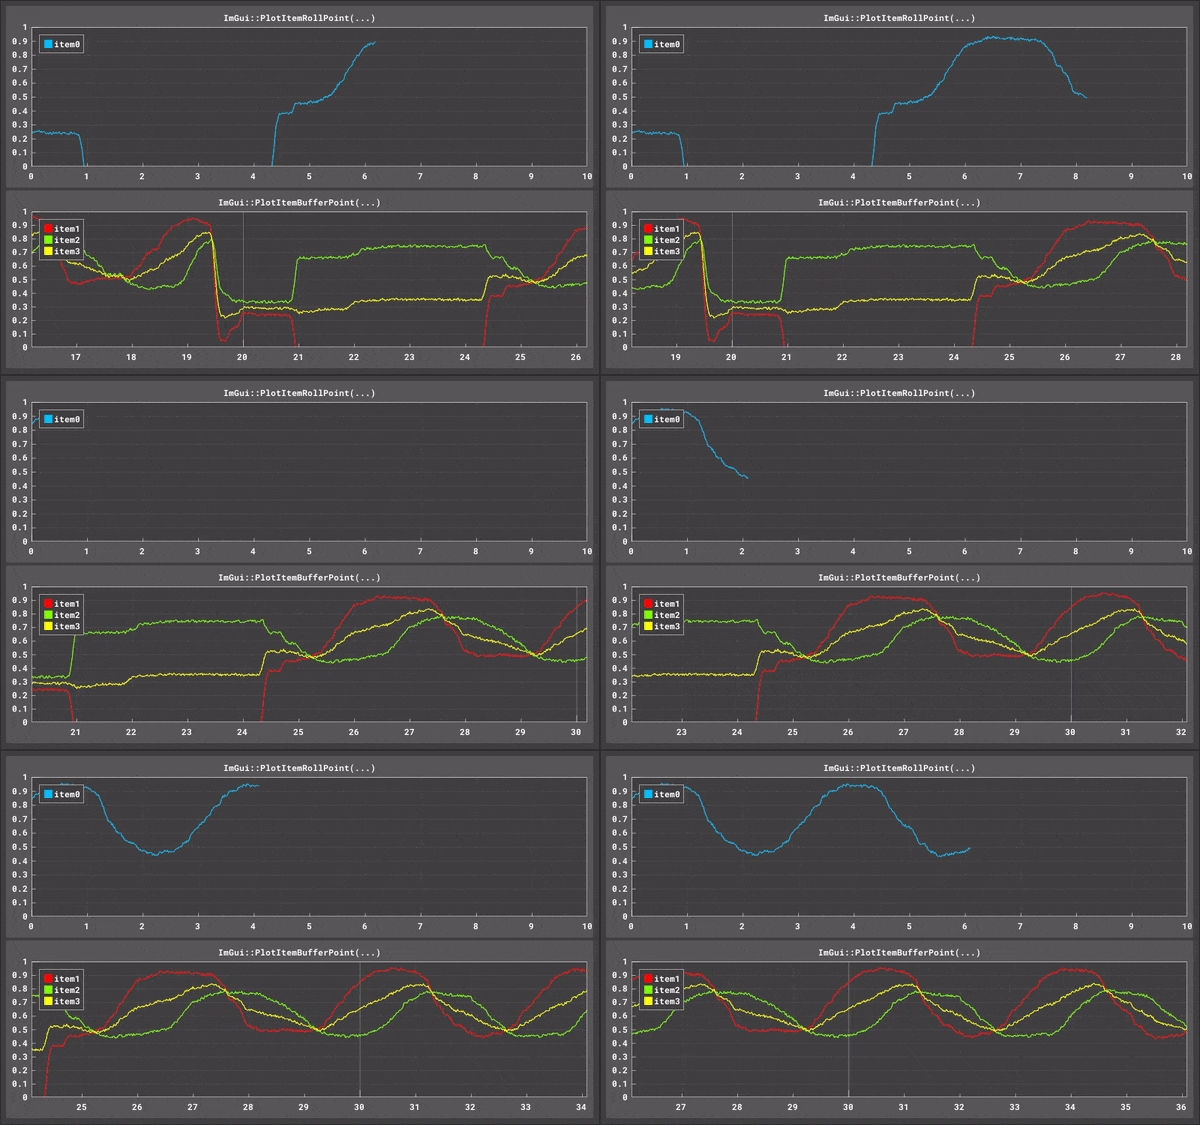
Here is a complete example to achieve this effect. You can place this code inside the MyApp::update() function from our previous lesson's structure.
// Place these as static members of your MyApp class or as static variables inside update()
static std::vector<float> history(1000, 0.0f);
static int history_offset = 0;
static double refresh_time = 0.0;

// Inside your MyApp::update() method:
ImGui::Begin("Real-time Plot");

// Add a new data point every 1/60th of a second
if (glfwGetTime() > refresh_time)
{
    // Get the current time for the sine wave phase
    float t = (float)glfwGetTime();

    // Create a new data point (e.g., sine wave with some noise)
    float new_value = 0.5f + 0.5f * sinf(t * 2.0f) + (rand() % 100) / 500.0f;

    // Add the value to our history buffer
    history[history_offset] = new_value;

    // Increment the offset, wrapping around if necessary
    history_offset = (history_offset + 1) % history.size();

    // Set the time for the next update
    refresh_time = glfwGetTime() + 1.0 / 60.0;
}

// Draw the plot
ImGui::PlotLines(
    "Frame Time",
    history.data(),
    history.size(),
    history_offset, // This is the key to making it scroll!
    "avg 16.6 ms",  // Example overlay text
    0.0f,           // Min Y
    1.5f,           // Max Y
    ImVec2(0, 120)  // Plot size
);

ImGui::End();
Experiment with this code! This is the fundamental building block of our "Variable Watcher".
Conclusion
You've now successfully rendered your first time-series plot! This is a significant milestone. While ImGui::PlotLines is a fantastic tool for simple visualizations, you can probably anticipate its main weakness: it requires ImGui to iterate over every single data point to render the graph. If history.size() were one million, your application would grind to a halt. This is the "observer effect" in action, and it violates the core principle of our telemetry engine.
Key Takeaways:
ImGui::PlotLinesis the fastest way to get time-series data on the screen in ImGui.- You can provide data either directly via a
float*array or more flexibly using avalues_getterlambda function. - The
void* dataparameter in the getter is a powerful tool for providing context to the rendering function without global variables. - By using a circular buffer and the
values_offsetparameter, you can create a real-time scrolling graph.
What's Next?
To overcome the performance limitations of PlotLines, we need to take full control of rendering. In our next lesson, we will dive into the ImGui draw list API (ImDrawList). You will learn how to issue low-level drawing commands to render custom shapes like lines, rectangles, and text directly to the screen. This is the essential skill we need to start building our own high-performance LOD Plotter from scratch.