Hello! Welcome back to the course.
In our last lesson, you successfully implemented a circular buffer to manage your plotter's data. This was a crucial step in ensuring your application has a constant memory footprint, making it a robust tool for long-running analysis. Your plotter is now "live" and stable, but it's still static. It's time to bring it to life with user interaction.
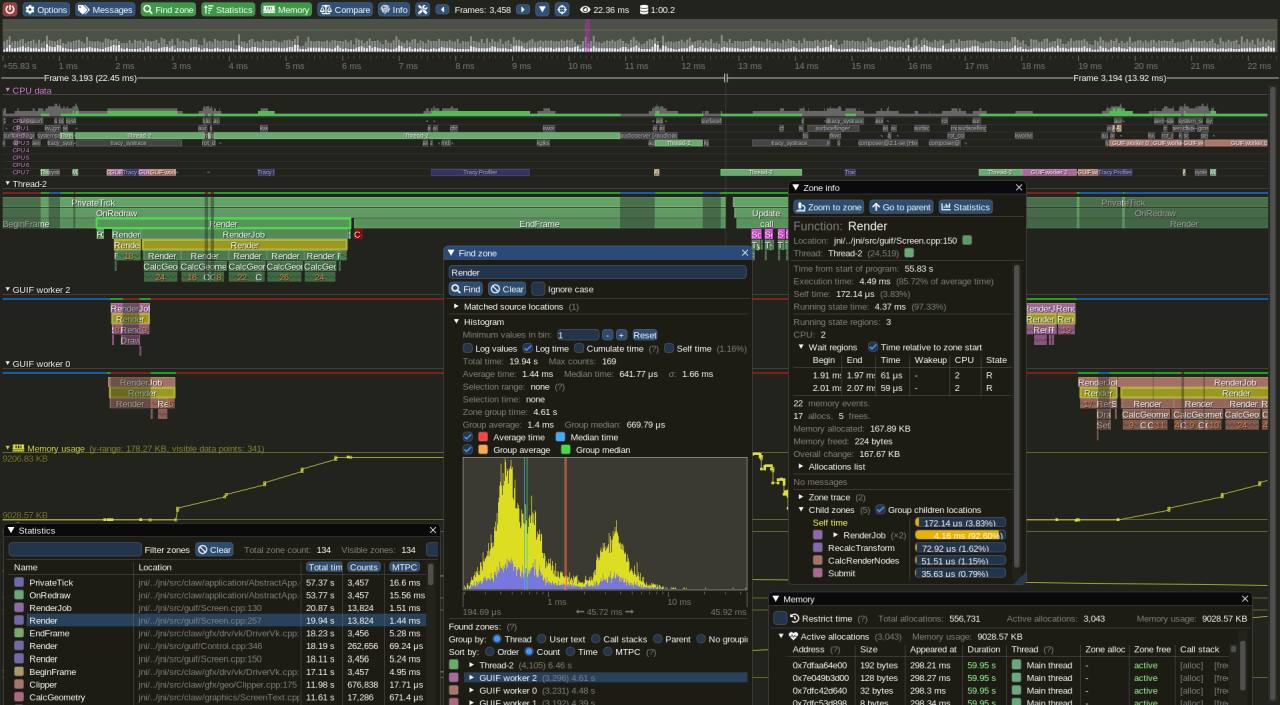
This lesson directly addresses the learning outcome: Implement interactive zoom functionality using the mouse wheel. We will delve into the mathematics of coordinate transformations and use ImGui's input system to allow users to zoom into specific regions of the plot. This is a fundamental feature of any professional analysis tool, like the one shown below, and a core skill in graphics programming.
The Challenge of Intuitive Zooming
A naive approach to zooming would simply scale the entire plot. If you try this, you'll notice that the plot always zooms in and out relative to a fixed point, usually the top-left corner (the origin). This is disorienting for the user, who naturally expects the zoom to be centered on their mouse cursor.
Our goal is to implement focal point preservation: the point on the graph directly under the mouse cursor should remain stationary as the user zooms in or out.
To understand the concept and the math involved, we'll start with a fantastic video that breaks down the problem from first principles.
The video 'Programming Panning & Zooming' by javidx9 provides an excellent conceptual foundation for what we're about to build. While he uses his own game engine, the C++ code and mathematical principles are universal.
First, watch the introduction from 00:00 to 02:04 to see a clear demonstration of panning and centered zooming. Then, watch the most important section from 13:55 to 17:29, which explains the core algorithm for making the zoom focus on the mouse cursor. Pay close attention to the idea of capturing the mouse's world coordinates before and after the scale changes.
The Algorithm for Centered Zoom
As the video explained, the key to centered zooming is to counteract the shift caused by scaling. We can break this down into a clear, step-by-step algorithm that you'll execute every time the mouse wheel is moved over the plot.
Let's define our key variables:
m_pan: AnImVec2that stores the view offset in world coordinates. This represents the world-space coordinate that is at the top-left of our plot window.m_zoom: Afloatthat stores the current zoom level or scale factor. A value of1.0fis no zoom.
Here is the algorithm:
- Capture Mouse Position: Get the current mouse cursor position in screen coordinates using
ImGui::GetMousePos(). - Find World Position (Before Zoom): Convert the mouse's screen position into world coordinates using your existing coordinate transformation logic. Let's call this
world_pos_before. - Update Zoom Factor: Read the mouse wheel delta from
ImGui::GetIO().MouseWheel. Use this value to updatem_zoom. An exponential change feels most natural, so we'll multiplym_zoomby a factor derived from the wheel delta. - Find World Position (After Zoom): Now that
m_zoomhas changed, the mapping from screen to world is different. Convert the same screen position from step 1 into world coordinates again. Let's call thisworld_pos_after. - Calculate the Difference: The world position under the mouse has shifted. The required correction is the difference between the two world positions:
delta = world_pos_before - world_pos_after. - Apply Correction: Add this
deltato yourm_panvariable. This shifts the entire view, effectively movingworld_pos_afterback to whereworld_pos_beforewas, keeping the point under the cursor stationary.
This logic may seem complex, but it elegantly ensures that the focal point of the zoom is always the user's cursor.
Implementing with ImGui
Now, let's translate this algorithm into C++ code within your LODPlotter class. First, you'll need to add the new member variables to store the view state.
// In your LODPlotter class definition
class LODPlotter {
    // ... existing members
private:
    // ...
    ImVec2 m_pan = {0.0f, 0.0f};  // View offset in world units (time, value)
    float m_zoom = 1.0f;         // Scale factor
};
Next, you'll need a function to handle user input. This function will be called at the start of your draw method.
The following resource provides a direct, practical implementation of this logic in an ImGui context.
Zoom in and out centered about the mouse cursor in 2D ...
This Stack Overflow question, 'Zoom in and out centered about the mouse cursor in 2D using ImGui', shows the exact C++ code needed to implement our algorithm. The accepted answer is concise and correct.
Read the accepted answer (the first answer with the green checkmark). Focus on the code block within the 'if (......)' statement. You will see it directly implements the algorithm we just discussed: screenToWorld before zoom, update zoom, screenToWorld after zoom, and adjust pan.
Based on that example, your input handling logic will look like this:
// In your LODPlotter class
void LODPlotter::handleInput(const ImVec2& canvas_pos, const ImVec2& canvas_size) {
    ImGuiIO& io = ImGui::GetIO();

    // Check if the plot area is hovered
    if (ImGui::IsMouseHoveringRect(canvas_pos, {canvas_pos.x + canvas_size.x, canvas_pos.y + canvas_size.y})) {

        // --- Zooming ---
        float wheel = io.MouseWheel;
        if (wheel != 0.0f) {
            const ImVec2 mouse_pos = io.MousePos;

            // 1. & 2. Get world position before zoom
            ImVec2 world_pos_before = screenToWorld(mouse_pos);

            // 3. Update zoom factor
            float zoom_delta = wheel * 0.1f;
            m_zoom *= std::pow(2.0f, zoom_delta);
            // Clamp zoom to reasonable limits
            m_zoom = std::max(0.1f, std::min(m_zoom, 100.0f));

            // 4. Get world position after zoom
            ImVec2 world_pos_after = screenToWorld(mouse_pos);

            // 5. & 6. Calculate correction and apply to pan
            m_pan += (world_pos_before - world_pos_after);
        }
    }
}
Updating Your Coordinate Transformations
For this to work, your screenToWorld and worldToScreen functions must be updated to use the new m_pan and m_zoom variables. Your coordinate system likely treats time as x and the plotted value as y.
Here are the updated transformation functions. Note the Y-axis inversion, which is common because screen coordinates typically have Y=0 at the top, while graphs have Y=0 at the bottom.
// In your LODPlotter class

// Converts a point from data/world space to screen space
ImVec2 LODPlotter::worldToScreen(const ImVec2& world_pos) const {
    const ImVec2 canvas_pos = ImGui::GetCursorScreenPos(); // Or pass as argument
    const ImVec2 canvas_size = ImGui::GetContentRegionAvail();

    float screen_x = canvas_pos.x + (world_pos.x - m_pan.x) * m_zoom;

    // Y is inverted: world 'up' is screen 'down'
    float screen_y = canvas_pos.y + canvas_size.y - (world_pos.y - m_pan.y) * m_zoom;

    return ImVec2(screen_x, screen_y);
}

// Converts a point from screen space to data/world space
ImVec2 LODPlotter::screenToWorld(const ImVec2& screen_pos) const {
    const ImVec2 canvas_pos = ImGui::GetCursorScreenPos(); // Or pass as argument
    const ImVec2 canvas_size = ImGui::GetContentRegionAvail();

    float world_x = (screen_pos.x - canvas_pos.x) / m_zoom + m_pan.x;

    // Y is inverted
    float world_y = (canvas_pos.y + canvas_size.y - screen_pos.y) / m_zoom + m_pan.y;

    return ImVec2(world_x, world_y);
}
You must now integrate these updated functions into all your drawing logic. The draw function in your LODPlotter will use worldToScreen to position the lines and rectangles of your plot, and your handleInput function will use screenToWorld to interpret mouse actions.
Test your understanding!
Question: Our zoom implementation (m_zoom *= std::pow(2.0f, zoom_delta)) is exponential, which feels natural. What would happen if we used a linear zoom instead (e.g., m_zoom += zoom_delta)? Why is exponential zoom generally preferred for this kind of UI?
Show answer
Linear zoom provides a poor user experience because the perceived effect of a zoom step depends on the current zoom level. For example, changing the zoom factor from 1.0 to 2.0 is a 100% increase in magnification and feels significant. However, changing it from 10.0 to 11.0 is only a 10% increase and would feel sluggish and barely noticeable.
Exponential zoom ensures that each "tick" of the mouse wheel corresponds to a consistent percentage change in magnification (e.g., always zooming in by 10%). This provides a much more uniform and intuitive feel across all zoom levels, from wide overviews to microscopic details.
Conclusion
Congratulations! You have just implemented one of the most important interactive features of your telemetry tool. By understanding and applying the mathematics of coordinate transformations, you've enabled intuitive, mouse-centered zooming.
Key Takeaways:
- Intuitive zooming requires preserving the focal point under the mouse cursor.
- The core algorithm is to calculate the mouse's world position before and after changing the zoom factor, and then adjust the pan/offset to compensate for the difference.
- This logic depends on robust
worldToScreenandscreenToWorldfunctions that account for bothpan(translation) andzoom(scale). - Exponential zoom (
m_zoom *= ...) provides a more uniform user experience than linear zoom (m_zoom += ...).
What's Next?
With zooming implemented, the next logical step is to add panning. In the next lesson, we will implement interactive panning functionality by dragging the mouse. You'll find that the m_pan variable you introduced today is the key to this next feature, and the groundwork you've laid will make it surprisingly simple to add.