Hello! Welcome to the final lesson in our module on UI and Regression Testing.
Over the last few lessons, we have built a solid testing foundation. We've learned to write unit tests for business logic, UI tests for user flows, and snapshot tests to prevent visual regressions. While these tests provide a safety net, a critical question remains: how much of our code is actually protected by this net? Are there critical error-handling paths or business logic branches that our tests never execute?
Today, we will answer that question. Our learning outcome is to interpret a code coverage report to identify untested areas in the codebase. We'll learn how to use Xcode's built-in tools to measure which parts of your app are exercised by your tests, allowing you to make data-driven decisions about where to focus your testing efforts.
What is Code Coverage?
Code coverage is a metric that measures the degree to which your application's source code is executed when your test suite runs. It's typically expressed as a percentage. While it doesn't measure the quality of your tests, it's an invaluable tool for discovering code that is completely untested.
To get a quick and clear conceptual overview, let's watch this short video.
What is code coverage? | Snack of the Week
This video from Sentry uses a simple cookbook analogy to explain the core idea behind code coverage and demonstrates it with a quick code example.
Watch from 00:52 to 01:54. Focus on how coverage is calculated and how the tool visually points out the untested 'divide by zero' case.
As you saw, a code coverage tool highlights lines of code that your tests didn't run, giving you a clear signal about where potential gaps in your test suite exist.
Enabling and Viewing Code Coverage in Xcode
Before you can see any reports, you first need to tell Xcode to gather coverage data while your tests are running. This is a simple one-time setup for your project's scheme.
This article from Apple's official WWDC24 documentation explains how to enable code coverage.
Read the four short paragraphs under the heading "Code Coverage, or Test Coverage." The key instruction is how to enable it from the scheme editor's Test action.
To summarize the steps:
- Open your project in Xcode.
- Go to Product > Scheme > Edit Scheme... (or use the shortcut
Cmd + <). - Select the Test action from the left-hand pane.
- Go to the Options tab.
- Check the box for Code Coverage.
Now, run your tests as usual (Cmd + U). After the tests finish, you can find the report in the Report Navigator.

The following video quickly reiterates where to find this report.
Unit Testing in iOS with XCTest
This video by Etisha Garg provides a practical look at navigating to the code coverage report within Xcode.
Watch from 14:55 to 15:22. This short clip will show you exactly where to click in the Report Navigator to open the detailed coverage view.
Interpreting the Report
Xcode presents coverage data in two main places: an aggregate report and inline annotations in the source editor.
1. The Aggregate Report View
This is the view you see when you click the "Coverage" tab. It gives you a high-level overview.
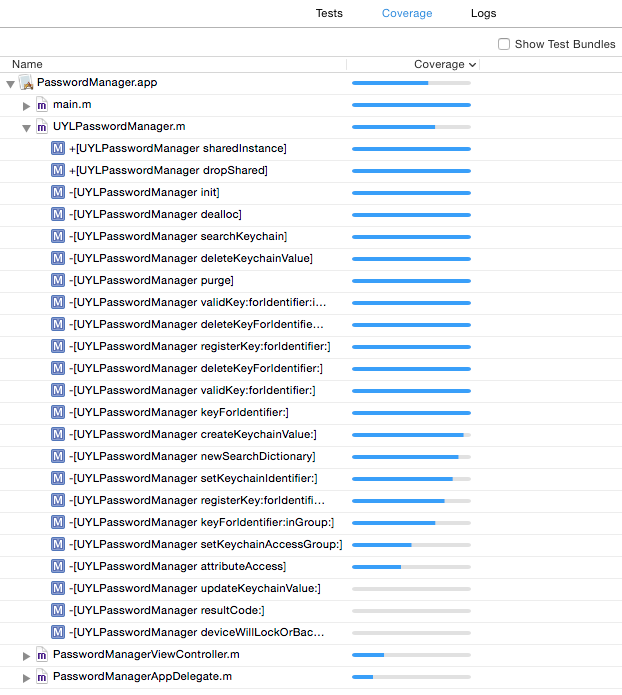
This view is excellent for getting a bird's-eye view and identifying files or entire features that have low test coverage.
2. The Source Editor Annotations
This is where the report becomes truly actionable. When you navigate to a source file from the coverage report, Xcode overlays the coverage data directly onto your code.
Let's see what this looks like and how to interpret it.
Unit Testing in iOS with XCTest
Continuing with the same video, this segment demonstrates how to read the visual cues in the source editor.
Watch from 15:22 to 16:15. Pay close attention to two things: The red and green stripes in the gutter that appear when you hover over a function, indicating uncovered and covered code paths. The execution count that appears to the right of each code block, showing how many times the tests executed that specific block. A 0 here means the code was never run.
The combination of the execution count and the color-coded gutter gives you precise, line-by-line feedback on what your tests are—and are not—doing.
From Insight to Action: Improving Your Tests
The real value of code coverage is using its insights to write better, more comprehensive tests. When you see a red bar or a 0 execution count on a piece of important logic, you have a clear action item: write a test that executes that code path.
The video you just watched identified an untested scenario: what happens when a user tries to add a task with an empty name? Let's now see the process of writing a test to cover that specific case.
Unit Testing in iOS with XCTest
This final clip demonstrates the complete feedback loop: finding an untested path and writing a new test to cover it.
Watch from 16:15 to 17:27. Observe how a new test function, test_addTask_withEmptyTask, is created specifically to address the gap found via the coverage report. After running the new test, you'll see the coverage report update to show that the previously red area is now green.
This workflow—Analyze, Test, Verify Coverage—is a powerful cycle for systematically improving the robustness of your app.
A Professional Perspective: Coverage as a Guide, Not a Goal
It can be tempting to chase a 100% code coverage score. However, in a professional context, this is often a sign of misplaced effort. A high coverage number is not a guarantee of quality.
This final video touches on the right mindset to have about testing.
What is code coverage? | Snack of the Week
Let's return to the Sentry video to hear a concluding thought on the purpose of testing.
Watch from 01:54 to 02:28. The key message is that testing is about gaining confidence in your code, even if you can't test for every single possibility.
Keep these points in mind:
- Coverage measures execution, not assertion. A test could run a line of code but have no
XCTAssertto verify its behavior is correct. The coverage tool wouldn't know the difference. - Focus on complexity. Use coverage reports to ensure your critical business logic, complex algorithms, and crucial error-handling paths are tested. Don't spend hours trying to get 100% coverage on simple view configuration code that is better served by a snapshot test.
- The Law of Diminishing Returns. The effort to get from 90% to 100% coverage is often immense and yields little value, as it usually involves testing trivial or boilerplate code.
Use code coverage as a diagnostic tool to find blind spots, not as a target to be blindly achieved.
Conclusion
Congratulations on completing the module on testing! You now have a comprehensive set of tools to ensure your app is functional, visually correct, and robust.
Key Takeaways:
- Code Coverage is a metric that reveals which parts of your code are executed by your tests.
- Enable coverage in your scheme's Test options to start gathering data.
- Interpret reports in the Report Navigator for a high-level view and in the source editor for line-by-line details (execution counts and color-coded gutters).
- Act on insights by writing new tests that target uncovered code paths, especially for critical business logic and error handling.
- Use it as a guide, not a goal. Aim for confidence in your code's correctness, not an arbitrary 100% score.
Preview of the Next Module:
We're now going to pivot from ensuring code quality to a fundamental aspect of application development: data persistence. Many complex apps need to save data locally on the device, and you've mentioned this is an area you want to build foundational knowledge in.
In our next lesson, we will begin the "Data Persistence with Core Data" module. We'll start at the very beginning, and our first goal will be to set up a Core Data stack, including the managed object model, context, and persistent store coordinator.