Introduction
Welcome to the final lesson of our first module on macroeconomic foundations. Over the past few lessons, we've built a strong conceptual toolkit. You've learned how to define and measure national output through GDP, and how to track the general price level using indices like the CPI. We also dissected the causes and effects of inflation. Now, it's time to put all that theory into practice.
This lesson is designed to meet the learning outcome: Interpret recent Indian GDP growth and inflation data using concepts from national income and price indices. We will transition from abstract definitions to concrete analysis, examining real, up-to-date figures for the Indian economy. This exercise is not just academic; it mirrors the kind of analysis performed by economists at the RBI to inform policy decisions. For you, this is a crucial skill, bridging the gap between static knowledge and its dynamic application in the real world.
Decoding India's Economic Performance
When economists assess the health of an economy, they look at two primary vital signs: growth and inflation. A government's Economic Survey provides the most authoritative snapshot of these indicators. Let's begin by looking at a high-level dashboard.
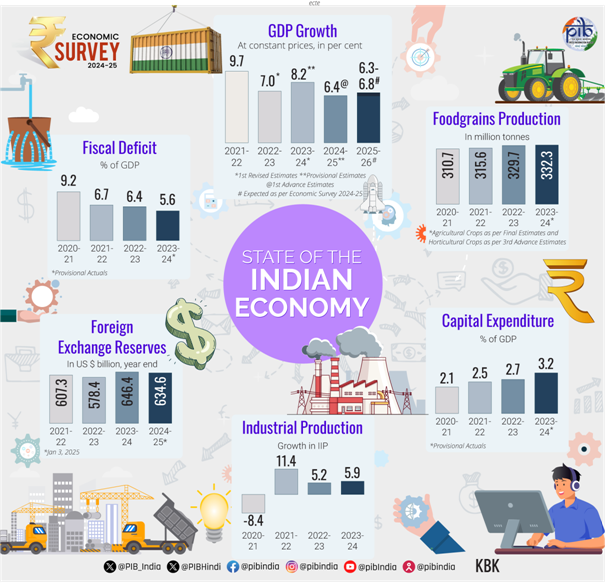
This image gives us the headline numbers. Our goal in this lesson is to go deeper and understand the story behind these figures.
Interpreting GDP Growth Data
The headline GDP growth rate is the most frequently cited measure of economic performance. For example, official estimates stated that India's real GDP grew by 8.2% in 2023-24. However, a single number tells only part of the story. To truly understand it, we need to disaggregate the data, much like you would analyze a complex system by examining its individual components and their interactions.
A great starting point is the most recent Economic Survey summary, which provides official estimates and projections.
summary of economic survey 2024-25
This Press Information Bureau (PIB) release summarizes the key findings of the latest Economic Survey. It contains the official growth estimates that form the basis of economic analysis and policy-making.
Read the section that begins here. As you read, identify the estimated real GDP growth for FY25 and the growth rates for the three main sectors of the economy: agriculture, industry, and services.
The figures you just read show that the overall GDP number is a composite of varying performances across different sectors. For instance, robust growth in the services sector might be partially offset by slower growth in agriculture, or vice-versa. This sectoral breakdown helps diagnose the sources of strength and weakness in the economy.
Beyond the Headline: Caveats and Nuances
A high growth number can sometimes be misleading if not interpreted with caution. An analyst must be aware of statistical effects that can distort the picture. The following video explains two such critical nuances: the "low base effect" and the relationship between real GDP, nominal GDP, and inflation.
India’s 8.2% GDP Growth | Implications for the Economy | Latest Update | Drishti IAS English
This video from Drishti IAS offers a critical analysis of a recent GDP announcement. It's particularly strong in explaining statistical effects that can inflate growth figures.
Please watch the following segments carefully: First, watch the overview of the key drivers of growth, which shows the sectoral contributions. Next, pay close attention to the explanation of the low base effect. The numerical example provided is an excellent way to grasp how a weak performance in the previous year can make the current year's growth rate appear unusually high. Finally, watch the crucial segment explaining the link between real GDP, the price deflator, and nominal GDP. This connects the concepts of growth and inflation and highlights an important implication for government finances.
Let's summarize the key insights from the video, as they are fundamental to a sophisticated analysis of GDP:
- The Base Effect: As you saw, year-on-year growth is a percentage calculation. If the denominator (last year's GDP) is unusually low—perhaps due to a recession or a temporary shock—even a moderate absolute increase in the numerator (this year's GDP) can result in a very high percentage growth rate. Always ask: what is this growth being compared to?
- The Deflator's Role: You learned that Real GDP = Nominal GDP / Price Deflator. The video brilliantly explained that a very low inflation rate (a small deflator) can mathematically boost the real GDP figure, even if nominal GDP growth is modest. This is a subtle but powerful point. While low inflation is good for consumers, it can strain government finances because tax revenues are linked to nominal GDP. If nominal GDP doesn't grow fast enough, the government may struggle to meet its fiscal deficit targets.
Interpreting Inflation Data
Now let's turn to the second vital sign: inflation. We've established that the Consumer Price Index (CPI) is the RBI's primary metric for its inflation-targeting mandate.
Let's look at the latest data. The Economic Survey summary you read earlier contains recent inflation figures. Let's revisit it to get the numbers.
summary of economic survey 2024-25
We return to the PIB release on the Economic Survey.
Find the paragraph that begins here. Note the figures for retail headline inflation and food inflation (CFPI).
You would have noticed a key detail: while overall headline inflation has softened, food inflation has increased. This points to the importance of deconstructing the inflation data.
Headline vs. Core Inflation in Practice
In the previous lesson, we discussed the difference between headline inflation (which includes all items) and core inflation (which excludes volatile food and fuel prices). This distinction is not just academic; it's a primary tool for diagnosing the nature of inflation.
- When food and fuel prices drive a wedge between headline and core inflation, it often points to cost-push pressures or supply-side shocks (like a poor monsoon or high global oil prices).
- When core inflation itself is rising, it often suggests more widespread, persistent demand-pull pressures in the economy.
The following graph vividly illustrates the impact of food prices on India's overall inflation.
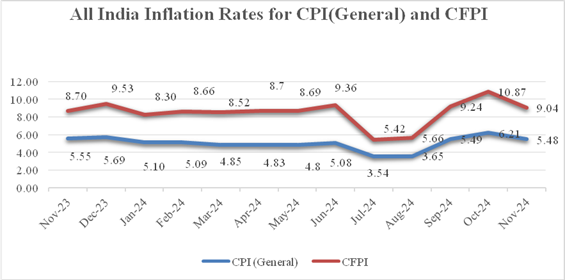
As you can see, the CFPI is significantly more volatile than the general CPI. In periods where the red line is well above the blue line, food prices are the primary driver of overall inflation. This is exactly what the Economic Survey text pointed out. An analyst at the RBI would see this and conclude that the inflation problem is partly rooted in specific supply-side issues in the food sector, which might require a different policy response than inflation driven by broad-based demand.
The PRS India summary of a recent Economic Survey provides a good example of attributing these price pressures to specific events.
This summary from PRS India offers a concise analysis of the economic trends for a recent fiscal year.
Read the section titled "Inflation". Pay attention to the specific causes mentioned for the rise in food inflation.
This confirms that analysts link data trends to real-world events, such as geopolitical conflicts and domestic weather patterns, to build a complete narrative.
The Evolving Picture: Rebasing the CPI
Finally, it's important to recognize that how we measure these indicators evolves over time to better reflect the economy. Your interest in technology makes this next point particularly relevant. Consumption patterns are changing rapidly, with increased spending on services, e-commerce, and digital entertainment. To remain accurate, the CPI basket must be updated to reflect these changes.
The following video explains the recent exercise to change the base year of the CPI and adjust the weights of different items.
India’s New CPI Explained: Inflation Calculation Changed | Impact on Interest Rates, EMI & Loans
This Unacademy IAS video discusses the recent changes to the CPI calculation methodology. It explains the "why" and "so what" of this important statistical update.
Watch these key segments: Changes in the basket: Note the new base year and the increase in the number of items, especially services. This reflects modern consumption habits. Changes in weightage: Understand why the weightage of food has been reduced while the weightage for core items has been increased. This is a direct consequence of the changing structure of household spending. Inclusion of e-commerce: This section explains how prices from online platforms are now being systematically included, a direct nod to the rise of digital commerce. Policy implications: This part connects the statistical change to real-world policy. Understand how these changes might affect the published inflation rate and, consequently, RBI's decisions on interest rates.
This rebasing exercise is significant. By reducing the weight of volatile food items and increasing the weight of more stable core items, the new CPI might become a more stable indicator of underlying inflation. This could, in the long run, allow the RBI to conduct monetary policy with a clearer signal, less distorted by temporary food and fuel price shocks.
Conclusion
In this lesson, we bridged the gap between theory and practice, applying the concepts from this module to interpret the vital signs of the Indian economy. You have learned not just to read the headline numbers, but to analyze them critically.
Here are the key takeaways from our analysis:
- Disaggregate Data: To understand GDP growth, break it down by its supply-side (agriculture, industry, services) and demand-side (consumption, investment) components.
- Beware of Statistical Nuances: Always consider the "base effect" and the role of the GDP deflator. A high real GDP growth figure might be amplified by a low base or low inflation.
- Deconstruct Inflation: Differentiate between headline and core inflation to diagnose whether price pressures are driven by volatile supply shocks (cost-push) or broad-based economic overheating (demand-pull).
- Context is Key: Connect data trends to real-world events (like monsoons or global events) and understand that measurement methodologies (like the CPI basket) evolve over time.
You have now completed the first module, building a solid foundation in macroeconomics. You can define, measure, and interpret the key indicators of national income and price stability.
In the next module, we will broaden our perspective to look at the Structure of the Indian Economy. Having learned to read the dashboard, we will now look under the hood to understand the engine itself—the roles of different sectors, the history of economic planning, and the major structural challenges and opportunities facing India.