Hello! In our last lesson, we took the first major step into Power Query, focusing on how to import data from common external sources like CSV and Excel files. You learned how to build a robust and refreshable connection to your data, leaving the manual copy-paste process behind.
Today, we move from getting the data to shaping it. Once data is imported, it's rarely ready for analysis. It might contain irrelevant columns, unnecessary rows, or incorrect formatting. This lesson will immerse you in the Power Query Editor, the digital workshop where you'll clean and prepare your data.
By the end of this session, you will be proficient in performing the three most fundamental data transformations that form the bedrock of data preparation: removing columns, filtering rows, and changing data types. Mastering these skills is non-negotiable for any aspiring data or business analyst.
1. Welcome to the Workshop: The Power Query Editor
When you choose to "Transform Data" after connecting to a source, Excel opens the Power Query Editor. This is a separate window from your main Excel workbook and is entirely dedicated to data transformation. Before we start making changes, let's get acquainted with the layout.
A great article from EvalAcademy, "Power Query For Data Preparation In Excel," provides a clear breakdown of the editor's main components.
Power Query For Data Preparation In Excel
Please read the section on navigating the Power Query editor. It will introduce you to the key areas we'll be using today.
Focus on this breakdown, which describes the Ribbon, Queries List, Data Preview, and, most importantly, the Applied Steps pane. Understanding what each part does will make the transformation process much more intuitive.
The key takeaway is that the Power Query Editor is a structured environment. Every action you take is recorded in the Applied Steps pane, creating a repeatable recipe that is automatically applied every time you refresh your data. Given your familiarity with programming logic, you can think of this as a visual script that executes sequentially.
2. Shaping the Data: The Three Core Transformations
Now that you're oriented, let's get our hands dirty. We'll focus on the three tasks outlined in the learning outcome. The video below by Kevin Stratvert provides a great practical walkthrough of these transformations in a realistic business scenario. We will watch relevant clips as we go.
How to use Microsoft Power Query
This video, "How to use Microsoft Power Query," is an excellent end-to-end demonstration. We'll refer to specific parts of it to see our concepts in action.
For now, just familiarize yourself with the context he sets up in the introduction and the initial tour of the Power Query Editor.
A. Removing Columns: Focus on What Matters
Often, source data contains columns that are irrelevant to your analysis (e.g., system IDs, metadata, or redundant information). Removing them is the first step in reducing clutter.
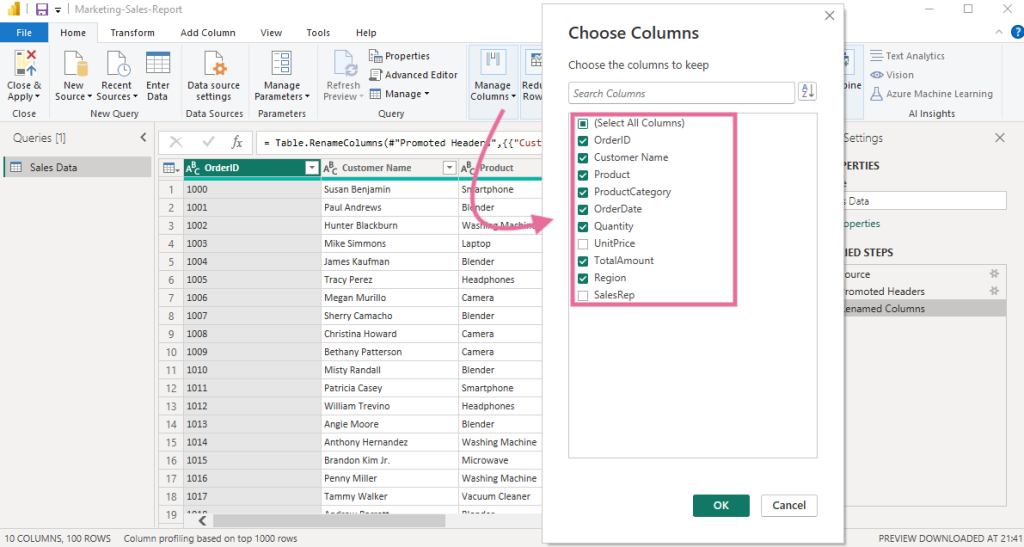
You have two main tools for this, found under the Home tab in the ribbon: Remove Columns and Choose Columns.
- Remove Columns: This removes the specific columns you have selected.
- Choose Columns (which has the same effect as "Remove Other Columns"): This keeps the columns you have selected and removes everything else.
This might seem like two ways of saying the same thing, but there's a crucial difference that impacts the reliability of your query.
The article "Common Power Query transformations" explains this brilliantly.
Common Power Query transformations (50+ powerful transformations explained)
This article details dozens of transformations. We'll focus on the section about managing columns.
Read the part under the "Manage Columns" heading, especially the explanation in this section. Pay close attention to the example with Column4.
To summarize:
- Use Remove Columns when you know you want to get rid of specific, named columns, and you're okay with new, unexpected columns in the source data being loaded in the future.
- Use Choose Columns / Remove Other Columns when you have a fixed set of columns you always want to keep, regardless of any future changes to the source file. This is generally the more robust and recommended practice for building reliable reports.
Let's see a quick demonstration of removing a column.
How to use Microsoft Power Query
Watch this short segment from Kevin Stratvert's video.
In this clip, he removes a column he doesn't need. Notice how the "Removed Columns" step immediately appears in the Applied Steps pane on the right.
B. Filtering Rows: Refining Your Recordset
Just as some columns are unnecessary, some rows are too. This could include totals or sub-totals, placeholder entries, or records that fall outside your analysis scope (e.g., old data or data from a specific region you want to exclude).
Filtering in Power Query is very similar to filtering in an Excel table. You can use the drop-down arrow in any column header to access the filter options.

You can:
- Filter specific values: Uncheck values from the list to exclude them. This is perfect for removing things like "(Blank)" or a "Grand Total" row.
- Use rules-based filters: For text, number, or date columns, you can use filters like "Does Not Equal," "Is After," or "Contains" to create more dynamic rules.
Watch how Kevin Stratvert filters out unwanted promotional entries from his sales data.
How to use Microsoft Power Query
Let's return to the video for another quick example.
Watch this clip showing how to filter out specific rows based on a value in the Order ID column. Again, observe the "Filtered Rows" step being added to the Applied Steps list.
C. Changing Data Types: Ensuring Data Integrity
This is perhaps the most critical—and often overlooked—transformation. A data type tells Power Query how to interpret the data in a column: Is it text? A number? A date?
Setting the correct data type is essential for three reasons:
- Correct Calculations: You can't perform mathematical operations (like SUM or AVERAGE) on a column that is formatted as text.
- Proper Sorting: Numbers and dates stored as text will sort alphabetically (e.g., 1, 10, 2, 20) instead of numerically.
- Functionality: Certain features, like date hierarchies, are only available when the column is a proper Date type.
Power Query usually adds an automatic "Changed Type" step when you import data, but its guesses aren't always correct. You should always review and manually set the data types. You can do this by clicking the icon to the left of the column header (e.g., ABC for text, 123 for whole number, a calendar for date).
Power Query For Data Preparation In Excel
Let's go back to the EvalAcademy article to read about changing data types.
Read the section titled Changing Data Types. The example of changing a numeric ID to Text is a very common scenario. Although an ID might contain only numbers, you would never perform a mathematical calculation on it, so treating it as text is more appropriate.
Now, see how this is applied in practice.
How to use Microsoft Power Query
Let's watch one last clip from the video.
Here, Kevin correctly identifies that his revenue, cost, and profit columns should be currency, not just numbers. Watch how he changes the data type for multiple columns at once.
3. Your Repeatable Recipe: The Applied Steps
As we've seen, every transformation you perform—removing a column, filtering a row, changing a data type—is recorded as a distinct step in the Applied Steps pane. This is the heart of Power Query's automation power.
This list is not just a history log; it is a live, editable script. You can:
- Click on a step to see what your data looked like at that point in the process.
- Rename steps to be more descriptive (highly recommended for complex queries).
- Delete a step by clicking the 'X' next to it to undo that transformation.
- Reorder steps by dragging them up or down.
This means that next month, when you get a new data file, you don't repeat these actions. You simply place the new file in the source folder and click "Refresh." Power Query will run through the entire list of applied steps automatically, delivering perfectly clean data to your Excel sheet.
Conclusion
In this lesson, you've moved beyond data import and into the core of data preparation. You now have the foundational skills to start cleaning and shaping datasets like a professional analyst.
Let's summarize the key takeaways:
- The Power Query Editor is Your Workshop: It's a dedicated environment for transforming data.
- Clean with Purpose: The three fundamental transformations are removing columns to reduce noise, filtering rows to focus on relevant records, and changing data types to ensure integrity.
- Think Robustly: Use "Choose Columns" to select what you want to keep, creating a more future-proof query.
- Automation through Applied Steps: Every click is recorded, creating a repeatable, automated process that saves immense time and prevents manual errors.
We have now concluded our module on Advanced Excel. You've built a strong foundation, moving from in-sheet analysis with pivot tables to powerful, automated data import and transformation with Power Query.
In our next lesson, we will venture into a new and essential domain for any data professional: Relational Databases and SQL. While Excel is a fantastic tool, vast amounts of business data are stored in structured databases. We will begin by exploring the fundamental concepts of these databases—tables, rows, columns, and keys—which will set the stage for you to learn SQL, the language used to communicate with them.