Hello! Welcome back to our DAX journey.
In the last lesson, we built the Revenue PM measure using DATEADD, giving us a flexible way to retrieve sales data from the prior month. This was the essential groundwork for today's topic.
Now, we're going to use that measure to answer a very common business question: "How are our sales trending month by month?" We will achieve this by calculating Month-over-Month (MoM) growth, both as an absolute value and as a percentage. The logic here will be very similar to the Year-over-Year calculations we performed earlier, which demonstrates how foundational DAX patterns can be reapplied to solve different analytical problems.
1. Understanding Month-over-Month Growth
At its core, MoM analysis compares performance in the current month to the immediately preceding month. It helps stakeholders understand short-term trends, the impact of recent marketing efforts, or seasonal fluctuations.
There are two key metrics we will calculate:
- Absolute MoM Growth: The raw difference in sales value between the current and previous month.
- Percentage MoM Growth: The absolute growth expressed as a percentage of the previous month's sales, which helps contextualize the scale of the change.
To get a quick overview of these concepts, please watch the first minute of this video.
Calculate Month on Month, Day on Day, Year on Year using DAX // Beginners Guide to Power BI in 2021
The video 'Calculate Month on Month, Day on Day, Year on Year using DAX' by Fernan | Power BI starts with a great, simple explanation of what MoM change represents.
Watch from 00:34 to 01:07. This clip provides a clear, conceptual introduction to both the absolute and percentage change we'll be calculating.
2. Calculating MoM Growth in DAX
With our [Total Revenue] and [Revenue PM] measures already in place, calculating MoM growth is straightforward. We will create two new measures.
Step 1: Absolute MoM Growth (Revenue MoM Abs)
The absolute change is simply the current month's revenue minus the prior month's revenue.
-
In Power BI, create a New measure.
-
Name it
Revenue MoM Abs. -
Enter the following DAX formula:
Revenue MoM Abs =
-- This measure calculates the absolute difference between current and prior month revenue.
-- It uses a variable to store the prior month's revenue for the IF check.
VAR PriorMonthRevenue = [Revenue PM]
RETURN
IF(
    NOT ISBLANK(PriorMonthRevenue),
    [Total Revenue] - PriorMonthRevenue
)
Dissecting the DAX:
- We first store the
[Revenue PM]result in a variable namedPriorMonthRevenue. Using variables (VAR/RETURN) makes your formulas easier to read and can improve performance, a concept we'll explore more in Module 9. - The
IF(NOT ISBLANK(...))is a crucial check. For the very first month in our data, there is no prior month, so[Revenue PM]will beBLANK. ThisIFstatement ensures we don't try to perform a calculation and simply return a blank in that case, keeping our report clean.
Step 2: Percentage MoM Growth (Revenue MoM %)
The percentage growth is the absolute change divided by the prior month's revenue.
-
Create another New measure.
-
Name it
Revenue MoM %. -
Enter the following DAX formula:
Revenue MoM % =
-- This measure calculates the percentage growth relative to the prior month.
-- It reuses our existing measures for clarity and consistency.
DIVIDE(
    [Revenue MoM Abs],
    [Revenue PM]
)
Dissecting the DAX:
- We use the
DIVIDEfunction, which you'll remember from Module 3. This is the safest way to perform division in DAX, as it automatically handles cases where the denominator ([Revenue PM]) might be zero or blank, preventing errors in your visual. - Once you create this measure, select it in the Fields pane and use the Measure tools tab in the ribbon to change its Format to Percentage. This tells Power BI to display the result correctly (e.g., 0.05 as 5%).
3. Visualizing Your MoM Analysis
Now, let's add your new measures to your report to see them in action.
- Select the matrix visual you have been using for time intelligence.
- Ensure
YearandMonthNameare on the rows. - Drag
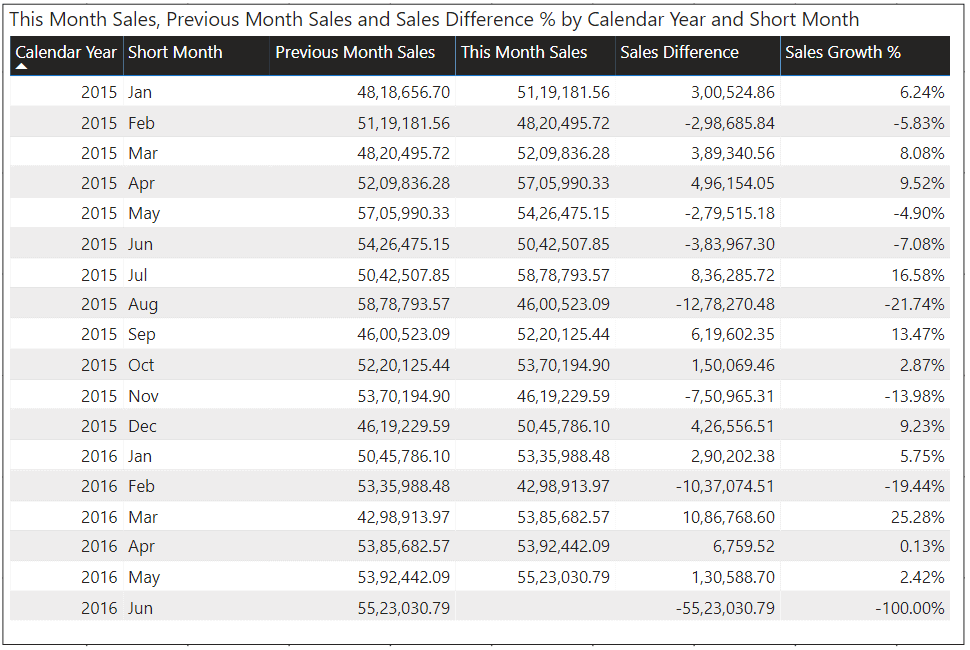
[Revenue MoM Abs]and[Revenue MoM %]into the Values field, alongside[Total Revenue]and[Revenue PM]. - Examine the results. For any given month, you should see the total revenue, the revenue from the month before, the difference between them, and the percentage growth that difference represents.
Your table should now look something like this, providing a comprehensive month-over-month view.
4. A Note on Alternative Functions: PREVIOUSMONTH
In our lessons, we've focused on using DATEADD because of its flexibility. However, when your goal is specifically to get the previous month, DAX provides a simpler "syntactic sugar" function: PREVIOUSMONTH.
PREVIOUSMONTH('Calendar'[Date]) is equivalent to DATEADD('Calendar'[Date], -1, MONTH).
While DATEADD can handle any interval (days, quarters, years) and any number of steps (e.g., -3 for three months ago), PREVIOUSMONTH is a convenient shortcut for this very common scenario.
To see a complete MoM calculation built from scratch using PREVIOUSMONTH, you can review the video we watched earlier.
Calculate Month on Month, Day on Day, Year on Year using DAX // Beginners Guide to Power BI in 2021
This longer segment from Fernan's video demonstrates the entire MoM calculation process using the PREVIOUSMONTH function. This will reinforce the concepts we've just applied and show you a common alternative approach.
Watch from 02:32 to 08:34. Pay attention to how the overall logic—getting the prior period, calculating the difference, and dividing—is identical to our method, even with a different core function.
Knowing both DATEADD and PREVIOUSMONTH makes you a more versatile analyst. You can choose the tool that best fits the specific task at hand.
Conclusion
Fantastic work! You have now mastered one of the most fundamental time-based comparisons in business intelligence. You can build a robust analysis of short-term trends from the ground up.
Key Takeaways:
- Month-over-Month analysis consists of calculating the absolute change and the percentage change.
- The absolute change is calculated by subtracting the prior month's value from the current month's value:
[Total Revenue] - [Revenue PM]. - The percentage change is calculated by dividing the absolute change by the prior month's value:
DIVIDE([Revenue MoM Abs], [Revenue PM]). - Using
IFto check for blanks andVARto structure your code are best practices for robust and readable DAX. - Always format your percentage measures correctly using the Measure tools in Power BI.
Preview of the Next Lesson:
We've now worked with SAMEPERIODLASTYEAR, DATEADD, and have been introduced to PARALLELPERIOD and PREVIOUSMONTH. In our next and final lesson of this module, we will explicitly compare the "big three" shifting functions—SAMEPERIODLASTYEAR, DATEADD, and PARALLELPERIOD—to solidify your understanding of their subtle but critical differences and when to use each one.