Hello! Welcome back to our course on mastering DAX.
In our previous lesson, we established the critical importance of using a dedicated calendar table for any serious time intelligence analysis. You learned that relying on date columns from your fact tables leads to gaps and incorrect calculations, and why Power BI's "Auto Date/Time" feature is not suitable for professional, scalable data models.
This lesson transitions from the "why" to the "how." We will build on that foundational knowledge and create our own dynamic calendar table. By the end of this ~60-minute session, you will be able to use the CALENDARAUTO function to generate a date table and then officially mark it as such within Power BI, preparing your model for the powerful time intelligence calculations you want to master.
1. Creating a Dynamic Date Range with CALENDARAUTO
The first step in building our calendar table is to generate a complete, continuous list of dates. For this, we'll use a powerful DAX function called CALENDARAUTO.
What is CALENDARAUTO?
The CALENDARAUTO function scans your entire data model for every column that has a Date or DateTime data type. It identifies the earliest year and the latest year present across all of those columns. Then, it generates a new, single-column table containing every single day from January 1st of the earliest year to December 31st of the latest year.
The key benefit is that it's dynamic. If you refresh your data and a new year of sales is added, CALENDARAUTO automatically extends the date range to include that new year without you needing to change the code.
Let's see a quick demonstration of this function.
Creating a simple date table in Power BI
The experts at SQLBI provide a concise introduction to using CALENDARAUTO to create a basic date table.
Please watch the first part of the video, from the beginning to 01:21. You'll see how to create a new calculated table and apply the CALENDARAUTO function to generate a date column based on the dates in the sales data.
A Word of Caution
The function's greatest strength—scanning all date columns—can also be a weakness. If your model includes dates unrelated to your analysis, like a BirthDate column in a Customers table, CALENDARAUTO will include those years. This could result in a date table that is unnecessarily large (e.g., spanning from 1910 to 2024).
This next video explains this potential issue clearly.
CALENDAR, CALENDARAUTO - DAX Guide
This DAX Guide video from SQLBI explains how CALENDARAUTO works under the hood and highlights the potential issue of it creating an overly large date range.
Watch from 00:45 to 01:39. The presenter shows an example where a BirthDate column causes the calendar to extend back to 1910.
For our current project, which only has the Sales table, this is not an issue. However, it's a critical concept to remember for future, more complex models. In a later lesson, we'll see how to use the FILTER function to constrain CALENDARAUTO if needed.
Your Turn: Create the Date Table
Now, let's apply this in your Power BI file.
-
Navigate to the Data view in Power BI Desktop.
-
In the Home or Table tools tab of the ribbon, click New table.
-
In the formula bar that appears, enter the following DAX expression:
Date = CALENDARAUTO() -
Press Enter.
You have now created a new table named Date. It contains a single column, also named [Date], with a continuous list of dates that covers the entire range found in your Sales[OrderDate] column.
2. Marking the Table as a Date Table
You have created the table, but there's one more crucial step. You must explicitly tell Power BI that this table is the official "Date Table" for your model. This action is what enables the special time intelligence functions to work correctly.
Marking a table as a date table does two things:
- Enables DAX Time Intelligence: It tells functions like
TOTALYTD,SAMEPERIODLASTYEAR, etc., which table and column to use as the source of truth for time. - Performs Validation: Power BI will check if your designated date column contains unique values and no blanks, ensuring it meets the requirements for time intelligence.
Let's look at the requirements and the process.
3 Ways to Create Date Table in Power BI
This article from Datawolfs lists the requirements for a proper date table and outlines the steps to create one.
Please read the short section titled 'Requirements for Creating a Date Table in Power BI Desktop'. Notice that 'The date table must be marked as a date table' is a key requirement.
Your Turn: Mark the Date Table
Follow these steps in Power BI:
- Make sure your new
Datetable is selected in the Fields pane. - The Table tools ribbon should appear. Click on Mark as date table.
- A dialog box will appear. In the dropdown, select the
Datecolumn. - Click OK.
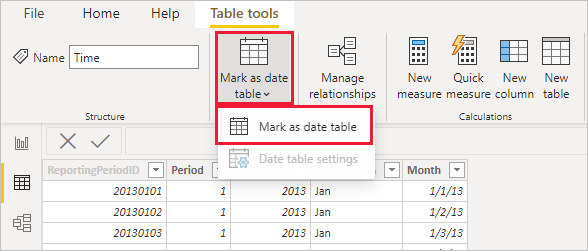
Let's watch a video segment that confirms this process and explains its importance.
Creating a simple date table in Power BI
This final segment from the SQLBI video shows exactly how to mark the table as a date table and summarizes why it's so important.
Please watch the clip from 06:58 to 07:47. The presenter marks the table and explains that this makes sure 'all time intelligence calculation will work in a smoother way'.
Your data model is now correctly set up with a dynamic, properly marked date table. While our table currently only has one column, it forms the correct foundation. In our next lesson, we will enrich this table with additional columns (like Year, Month, and Quarter) to make it truly useful for analysis.
Conclusion
Excellent work in this lesson. You have successfully transitioned from theory to practice by building the cornerstone of our time intelligence model.
Key Takeaways:
- The
CALENDARAUTO()function is used to create a new calculated table containing a continuous, dynamic range of dates based on the data in your model. CALENDARAUTOgenerates a full calendar (Jan 1 - Dec 31) for all years found in any date column in your model.- It is a mandatory best practice to Mark as date table in the Power BI interface. This step enables DAX time intelligence functions and validates your date column.
Preview of the Next Lesson:
A single column of dates isn't enough to build insightful reports. In our next lesson, you will learn how to add useful columns to our new Date table—such as Year, Quarter, Month Name, and Day of the Week—using DAX. After that, we will establish the relationship between our new Date table and the Sales fact table, fully integrating it into our data model.