Hello! Welcome to your sixth lesson in the "Network and Internet Fundamentals" module.
In our last lesson, we traced the entire theoretical journey of a web request—from a DNS lookup to the final rendering of a page. We talked about how your browser sends an HTTP GET request and receives an HTTP response, both of which contain important metadata in their headers.
Today, we're moving from theory to practice. You'll learn how to use the developer tools built into your web browser to see this process live. This lesson will empower you to inspect the very requests and responses your browser makes, which is a fundamental skill for understanding how websites work and how they can be attacked.
A Refresher on HTTP Messages
Before we open the tools, let's quickly solidify our understanding of what we're looking for. As we discussed, every HTTP interaction involves a request and a response, both structured with headers and an optional body.
The headers contain crucial information for the client and server. For example:
- A request header like
User-Agenttells the server what browser you're using. - A response header like
Content-Typetells your browser if it's receiving an HTML page, an image, or something else. - The server's response also includes a status code that tells you if the request was successful (
200 OK), if the page wasn't found (404 Not Found), or if there was a server error (500 Internal Server Error).
To get a comprehensive review of these components, please watch the following video segment.
HTTP Crash Course & Exploration
This video from Traversy Media provides an excellent crash course on HTTP, covering the key methods, the structure of headers, and common status codes. Watching this will reinforce the concepts from our previous lesson.
Please watch from 03:33 to 11:40. Focus on understanding: The main HTTP methods (GET, POST, PUT, DELETE). The different types of headers (General, Response, Request) and what some common ones mean (e.g., Content-Type, User-Agent, Server). The meaning of different status code ranges (200s for success, 400s for client errors, 500s for server errors).
Your Toolkit: The Browser's Network Tab
Now that those concepts are fresh in your mind, let's find them in the wild. Every modern web browser (like Chrome, Firefox, or Edge) comes with a powerful suite of "Developer Tools." We are interested in one specific tool: the Network tab. This tab records every single network request the browser makes while it's open, allowing us to dissect each one.
The following video shows a live demonstration of how to use this tool.
HTTP Crash Course & Exploration
In this part of the same video, the presenter demonstrates how to use the Chrome Developer Tools to inspect live network traffic. This is a perfect practical walkthrough of today's learning outcome.
Please watch from 12:47 to 16:19. As you watch, pay close attention to how he: Opens the 'Network' tab in the developer tools. Reloads the page to capture all the requests. Selects the main document request. Switches to the 'Headers' tab to view the Request and Response headers.
Hands-On Practice: Inspecting a Web Request
Now it's your turn to apply what you've just seen. We'll walk through the process step-by-step.
Step-by-Step Guide
- Open a new tab in your browser and go to a simple website, like
http://example.com/. This is a great site for practice because it's very basic. - Open the Developer Tools. You can usually do this by right-clicking anywhere on the page and selecting "Inspect", or by pressing
F12orCtrl+Shift+I(Cmd+Option+Ion Mac). - In the panel that appears, click on the "Network" tab. It might be empty at first.
- With the Network tab open, reload the page. You will see one or more entries appear in the log. Each entry is a separate request.

- Click on the first request in the list, which should be
example.com. This is the request for the main HTML document itself. - The details pane will now show information about this request. Make sure the "Headers" tab is selected.
You should now see a detailed breakdown of the request and response, just like in the video and the image below.
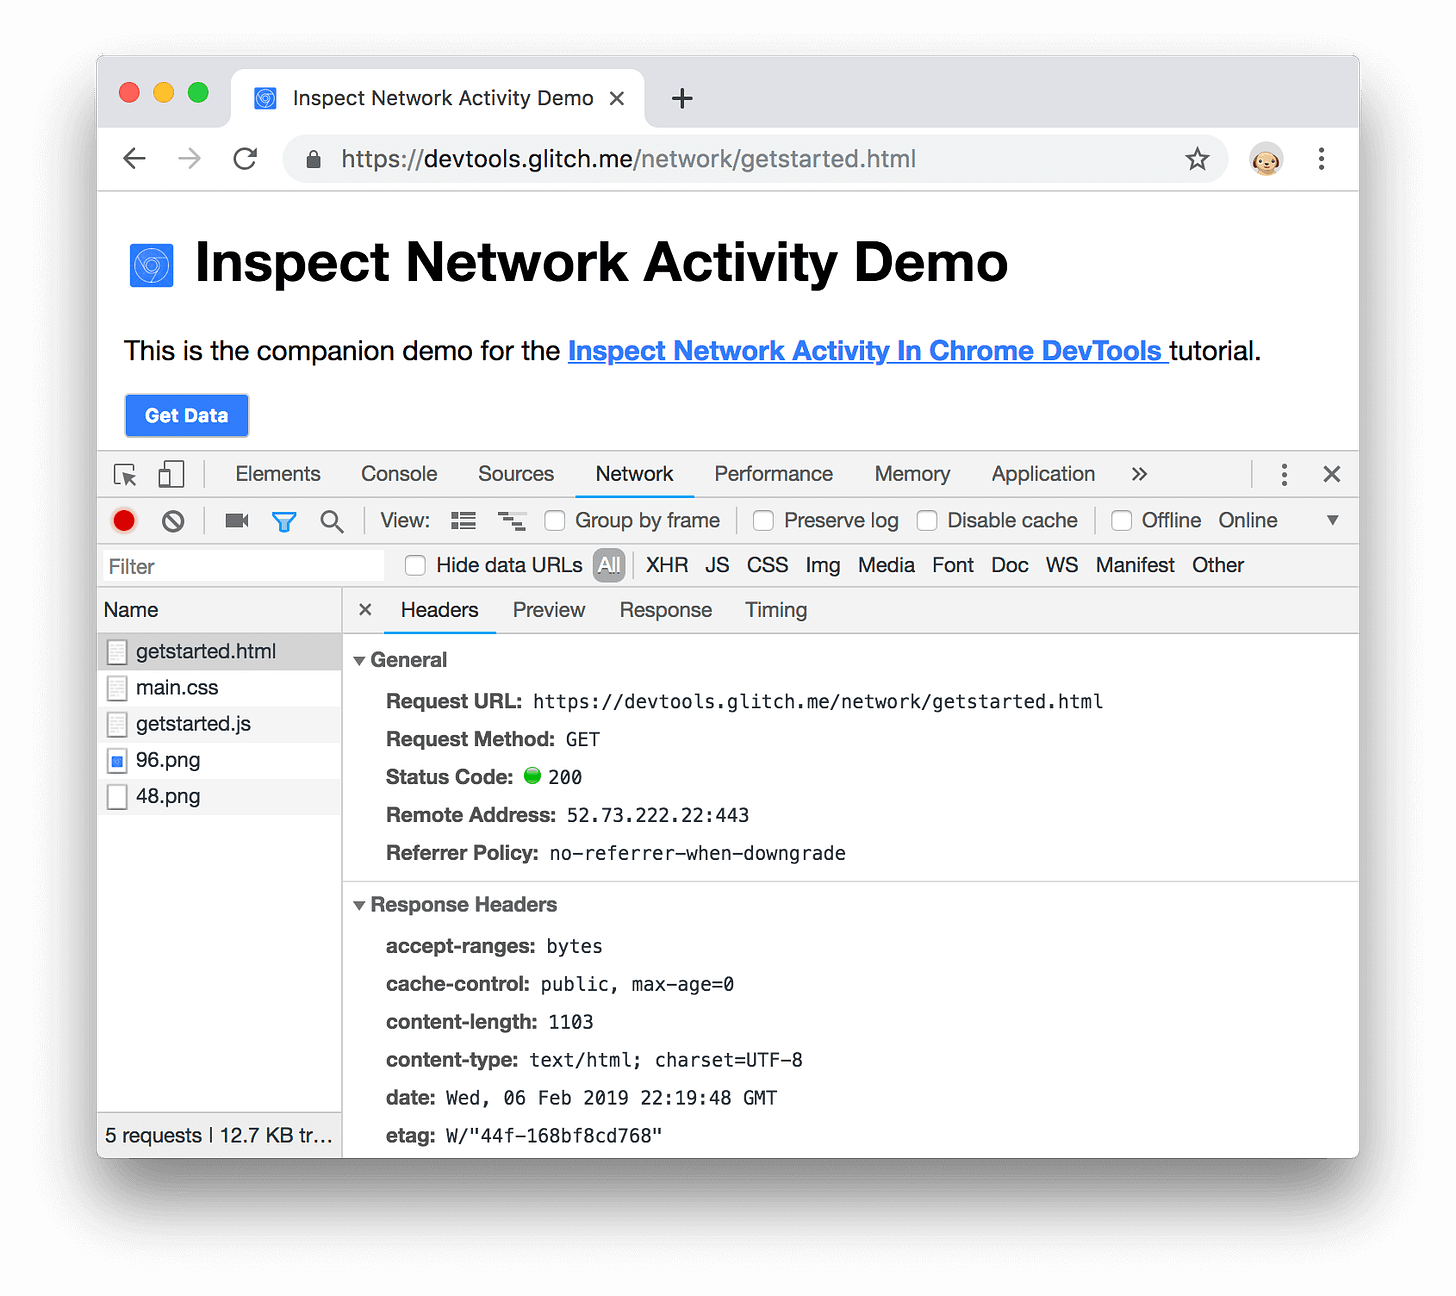
Take a moment to explore these headers. Can you find the following information?
-
In the General section:
Request URL: The full URL you requested.Request Method: Should beGET.Status Code: Should be200 OK(indicated by a green light).
-
In the Response Headers section:
Content-Type: This tells the browser the format of the data. Forexample.com, it should betext/html.Server: This sometimes tells you what web server software the site is running (e.g., Apache, Nginx). This is valuable information for an attacker.Content-Length: The size of the response body in bytes.
-
In the Request Headers section:
Host: The domain name of the server you're contacting.User-Agent: A long string identifying your browser and operating system. Websites can use this to serve different content to different devices.
Feel free to visit a more complex website, like wikipedia.org or your favorite news site, and repeat the process. You'll see dozens of requests for HTML, CSS files, JavaScript files, and images, each with its own set of headers. Try using the filter bar at the top of the Network tab to show only images (Img) or other resource types.
Conclusion
Congratulations! You've successfully bridged the gap between the theory of HTTP and its real-world application. Being able to inspect web traffic is like having a superpower—you can now peek behind the curtain of any website and see exactly how it communicates.
Key Takeaways:
- Browser Developer Tools are a powerful built-in feature for analyzing web traffic.
- The Network tab logs all requests a page makes, allowing you to inspect each one.
- By selecting a request and viewing the Headers tab, you can see the real
RequestandResponseheaders, including theStatus Code,Content-Type, andUser-Agent. - This skill is essential for diagnosing website issues, understanding how web applications function, and forming the basis of web security analysis.
Next Steps
In this lesson, we used the browser's tools to inspect HTTP traffic. However, this only shows communication initiated by the browser. In our next and final lesson for this module, we will learn to capture and analyze basic network traffic using Wireshark. Wireshark is a professional-grade tool that can capture all network traffic on your computer, giving you a much deeper and more comprehensive view of what's happening on your network.