Hello! Welcome to the final lesson in our "Scalability and Performance Principles" module.
In our last session, we established a systematic approach to diagnosing performance problems. You learned to act like a detective, using methodologies like the Four Golden Signals and the USE method to pinpoint where a system is failing. However, identifying a bottleneck is only half the battle. In a system design interview, after you state, "My investigation points to a database bottleneck due to slow queries," the immediate follow-up will be, "So, what are you going to do about it?"
This lesson is designed to answer that exact question. Our learning outcome is to map common performance bottlenecks to appropriate mitigation patterns. We will build a "playbook" of solutions that you can deploy in an interview when you're asked to fix a performance issue. This closes the loop on our performance investigation, moving us from diagnosis to resolution.
A Framework for Bottlenecks and Solutions
Performance bottlenecks typically fall into a few key categories. For a backend engineer, the most common suspects are the CPU, memory, I/O (disk and network), and the database.
To build our playbook, we'll use a comprehensive article that outlines these common bottlenecks and their corresponding solutions. This will provide the structure for our lesson.
What are common performance bottlenecks in a system
Let's begin by reading an overview of the most common system bottlenecks and the high-level strategies to address them. This article provides an excellent framework for our discussion.
Please read the sections titled 'CPU Bottlenecks', 'Memory Bottlenecks', 'I/O Bottlenecks', and 'Database Bottlenecks'. As you read, focus on the 'How to address it' portion of each section. We will be expanding on these patterns with more specific examples.
Now that you have a general map, let's dive into each area, connect it to the diagnostic signals from our last lesson, and explore specific mitigation patterns with practical examples.
1. The CPU Bottleneck Playbook
- Symptoms (from last lesson): High CPU utilization (e.g., >80% sustained), a long scheduler run queue (high saturation).
When you've identified the CPU as the bottleneck, here are the primary patterns to discuss:
| Mitigation Pattern | Description | When to Use It |
|---|---|---|
| Code & Algorithm Optimization | Refactor inefficient code. This could mean replacing a brute-force algorithm with a more efficient one (e.g., O(n²) to O(n log n)) or optimizing "hot spots" found via profiling. | Always the first step. Before scaling hardware, ensure the software is not being wasteful. A classic example is optimizing a complex data transformation logic that is CPU-bound. |
| Caching | Store the results of expensive computations in a fast, in-memory store like Redis or Memcached to avoid re-calculating them on subsequent requests. | For read-heavy workloads where the same data is requested repeatedly. This converts a CPU-bound operation (re-computation) into a much faster I/O-bound operation (cache lookup). |
| Offloading Heavy Tasks | Move CPU-intensive, non-critical work out of the request-response path. Use a message queue (like RabbitMQ or SQS) and background workers to process these tasks asynchronously. | For operations that don't need to be synchronous, like generating a PDF report, processing a video upload, or sending a welcome email. The user gets a fast initial response. |
| Horizontal/Vertical Scaling | Vertical: Upgrade to a more powerful server with a faster CPU. Horizontal: Add more servers and distribute the load among them using a load balancer. | When code is already optimized, but the traffic volume simply exceeds the capacity of a single machine. Horizontal scaling is the standard for modern cloud architectures. |
A great, practical video from ByteByteGo walks through several of these API performance enhancements.
Top 7 Ways to 10x Your API Performance
This video covers several practical optimization techniques. We'll reference different parts of it throughout the lesson. For now, let's focus on a CPU-specific optimization: using lightweight serializers.
Watch the short segment from 03:50 to 04:23. It highlights how even the choice of a JSON serialization library can impact CPU usage and API response times. It's a great, specific example of code-level optimization.
2. The Memory Bottleneck Playbook
- Symptoms: High memory utilization, OS swapping data to disk (thrashing), frequent or long garbage collection (GC) pauses, and Out-of-Memory (OOM) errors.
When memory is the limiting factor, your mitigation strategies focus on using it more efficiently.
| Mitigation Pattern | Description | When to Use It |
|---|---|---|
| Fix Memory Leaks | Identify and fix code paths where memory is allocated but never released after it's no longer needed. Use tools like heap profilers to track down object allocation patterns. | When you observe memory usage constantly growing over time without ever decreasing, even under stable load. This is a critical bug fix. |
| Efficient Data Handling | Avoid loading large datasets into memory all at once. Process large files or database result sets in chunks or streams. For APIs, return large collections of data in paginated form. | When dealing with large files, database exports, or API endpoints that could return thousands of records. This is a fundamental pattern for building robust services. |
| Optimize Data Structures | Choose data structures that are memory-efficient for your specific use case. For example, in some languages, a primitive array of integers is more memory-efficient than a list of integer objects. | When you are storing very large amounts of data in memory (e.g., for a cache or in-memory analytics) and need to minimize the memory footprint. |
| Scaling | Vertical: Increase the amount of RAM on the server. Horizontal: Add more servers to distribute the memory load. | After software optimizations have been exhausted and the working set of data for the application genuinely requires more memory than a single machine can provide. |
3. The I/O Bottleneck Playbook (Disk & Network)
- Symptoms: Low CPU utilization but high request latency, high disk wait times, or slow network transfers.
I/O operations are orders of magnitude slower than CPU operations, making them a common bottleneck.
A. Disk I/O
| Mitigation Pattern | Description | When to Use It |
|---|---|---|
| Upgrade Storage | Replace slower Hard Disk Drives (HDDs) with faster Solid-State Drives (SSDs), particularly NVMe SSDs for the lowest latency. | When your application is heavily dependent on random disk access and iostat shows high disk utilization and wait times. |
| Caching | Keep frequently accessed data from the disk in memory. This is the single most effective strategy for reducing read I/O. | For any read-heavy application. This applies to database queries, file access, API call results, etc. |
| Asynchronous I/O | Perform disk writes (like logging) on a separate thread or process, so the main application thread isn't blocked waiting for the disk write to complete. | In high-throughput systems where every millisecond in the request path counts. Asynchronous logging is a classic example. Top 7 Ways to 10x Your API Performance covers this from 04:53 to 05:38. |
B. Network I/O
| Mitigation Pattern | Description | When to Use It |
|---|---|---|
| Reduce Payload Size | Use compression (like Gzip or Brotli) on API responses. Return only the data fields the client actually needs (don't just SELECT *). |
For APIs that return large amounts of data, especially to mobile clients or users on slow networks. Top 7 Ways to 10x Your API Performance covers this from 04:23 to 04:53. |
| Pagination | Break up large API responses into smaller "pages" that the client can request one at a time. | For any API endpoint that could return a large list of items (e.g., a user's order history, a list of products). Covered in Top 7 Ways to 10x Your API Performance from 03:26 to 04:07. |
| Reduce Round Trips | Instead of making many small network requests, batch them into a single larger request. This is particularly relevant when communicating between microservices. | When a client or service needs to fetch multiple distinct pieces of data from another service. Patterns like GraphQL are designed to solve this. |
| Use a CDN | A Content Delivery Network (CDN) caches static assets (images, JS, CSS) at edge locations closer to users, reducing latency and offloading your origin servers. | For any web application with geographically distributed users and significant static content. |
4. The Database Bottleneck Playbook
- Symptoms: High latency on API calls that interact with the database, slow query logs, high CPU or disk I/O on the database server itself.
For backend engineers, the database is often the central performance challenge. Your playbook here needs to be robust.
8 Most Important System Design Concepts You Should Know
Let's watch a few clips that highlight some of the most common database bottlenecks and their solutions.
Watch the segments covering caching for reads (00:14-01:09), async writes for write-heavy loads (01:09-02:06), indexing (04:55-05:22), and sharding (05:22-06:08). This gives a great high-level overview of the major database optimization strategies.
Building on that overview, here is a more detailed breakdown.
| Mitigation Pattern | Description | When to Use It |
|---|---|---|
| Query Optimization | Add Indexes: This is the #1 fix for slow read queries. An index allows the database to find data without scanning the entire table. Use EXPLAIN to analyze query plans and identify missing indexes. |
When your slow query log shows queries with high latency that are performing full table scans on large tables. |
| (Query Opt. cont.) | Fix N+1 Queries: An N+1 query happens when you fetch a list of items (1 query) and then loop through them to fetch related data for each item (N queries). The fix is to fetch all the related data in a single second query. | This is an extremely common application-level bug. The video Top 7 Ways to 10x Your API Performance has a perfect explanation from 02:44 to 03:39. |
| Connection Management | Use Connection Pooling: Establishing a database connection is expensive. A connection pool maintains a set of open connections that can be reused by the application, drastically reducing latency. | This is non-negotiable for any production application. Failing to use a connection pool will quickly bring down a database under any significant load. |
| Architectural Patterns | Caching: Implement a cache (like Redis) to store the results of frequent, expensive, or static queries. | For read-heavy workloads. This can reduce load on the database by 90% or more for certain queries (e.g., fetching a user's profile). |
| (Arch. Patterns cont.) | Read Replicas: Create read-only copies of your primary database. Direct all write traffic to the primary and distribute read traffic across the replicas. This separates read and write workloads. | When your application is read-heavy and a single database instance cannot handle the read volume, even with optimized queries and caching. |
| (Arch. Patterns cont.) | Sharding: Horizontally partition the data across multiple database servers. Each server holds a subset of the data. This is a complex but powerful technique for scaling both reads and writes. | As a "last resort" when a single database (even with read replicas) can no longer handle the write volume or the total data size. It dramatically increases operational complexity. |
For a deeper dive into database-specific issues, the article "Database Performance Optimization: Ultimate Guide" from Redis (LINK) is an excellent resource covering topics like lock contention (section 5) and inefficient query execution plans (section 3) in more detail.
Summary: From Symptoms to Solutions
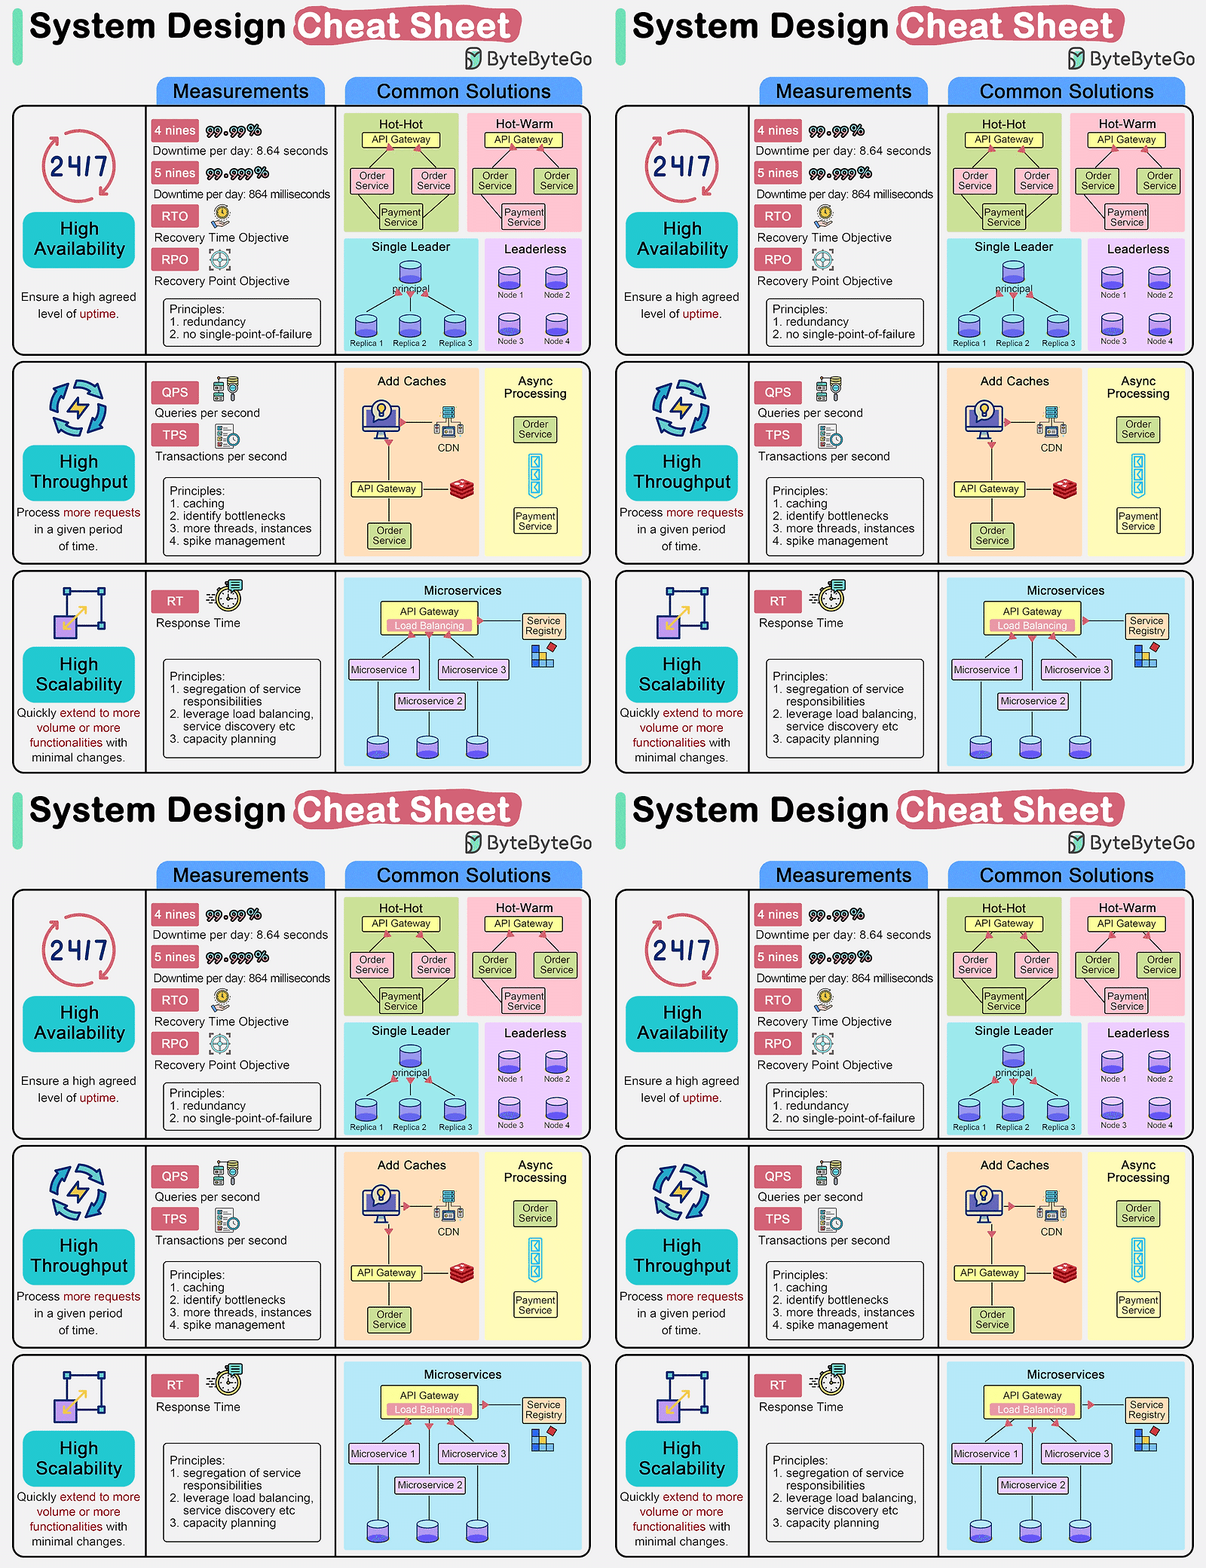
This cheat sheet provides a compact visual summary, connecting high-level goals like "High Throughput" to the patterns we've just discussed.
Conclusion
You have now completed the journey from identifying performance bottlenecks to prescribing effective solutions. You have a structured playbook that maps symptoms to mitigation patterns, a critical skill for any senior engineer.
Key Takeaways:
- Have a Structured Playbook: For each major bottleneck type (CPU, Memory, I/O, Database), have a prioritized list of mitigation strategies.
- Optimize Software First: Always start with code optimization, query tuning, and caching before recommending expensive hardware scaling.
- Caching is a Universal Tool: Notice how caching appeared as a solution for CPU, Disk I/O, and Database bottlenecks. It's one of the most powerful tools in your arsenal.
- Know When to Escalate: Understand the trade-offs of more complex solutions. Read replicas add complexity; sharding adds significant complexity. Articulate these trade-offs in an interview.
This lesson concludes the "Scalability and Performance Principles" module. You are now equipped to discuss both the diagnosis and treatment of performance issues. Our next module, "Data Storage and Database Design," will build directly on this foundation as we dive deeper into the trade-offs between SQL and NoSQL, indexing strategies, and sharding patterns.