Hello! Welcome back to your system design preparation.
In our last lesson, we focused on how to methodically gather functional and non-functional requirements. You learned to ask targeted questions to establish the scope, features, and constraints of a system, including key figures like Daily Active Users (DAU) and read-to-write ratios.
Today, we'll take those abstract numbers and make them concrete. This lesson is about performing back-of-the-envelope calculations (BOTEC). We'll translate the requirements you've gathered into tangible estimates for traffic (QPS), storage, and bandwidth. This skill is a critical signal of seniority in an interview, as it demonstrates your ability to quickly reason about scale and make data-informed architectural decisions from the very beginning.
Why Bother with "Rough" Math?
In a system design interview, you are not expected to be a human calculator. The goal of back-of-the-envelope math is not perfect precision. Instead, it serves three key purposes:
- Sanity Checking: It helps you quickly determine the order of magnitude of the problem. Will your system need 10 servers or 10,000? Will it store terabytes or petabytes of data? This prevents you from designing a system that is wildly over or under-provisioned.
- Guiding Design Decisions: The numbers you calculate will directly influence your choice of technologies and architecture. A high read QPS might suggest an aggressive caching strategy. Massive storage needs might point towards a distributed object store like Amazon S3.
- Meeting Interviewer Expectations: This is a standard part of the system design interview script. Executing it well shows you have a structured, comprehensive approach and can connect business requirements to technical reality.
Let's begin with a short video that explains the purpose and importance of these estimations in the context of a system design interview.
Back-Of-The-Envelope Estimation / Capacity Planning
The ByteByteGo channel provides a concise introduction to why back-of-the-envelope math is such a useful tool. Pay attention to how it's used to quickly make high-level design decisions.
Watch the first part of this video (00:00 - 01:18) to understand the core philosophy behind these calculations.
The Art of Approximation: Key Numbers and Techniques
To perform these calculations quickly, you need to simplify. This means rounding numbers aggressively and having a few key figures memorized.
Essential Approximations:
- 1 day ≈ 86,400 seconds. For quick math, round this to 100,000 seconds ().
- 1 month ≈ 2.6 million seconds. Round to 2.5 million seconds ().
- 1 year ≈ 365 days. Round to 400 for easier multiplication.
Common Data Sizes to Remember:
It's helpful to have a general idea of the size of common data types. You can always state your assumption in an interview, but starting from a reasonable baseline is best.
Back To Envelope Or Capacity Estimation - Wisdom - GitBook
This guide provides a list of essential numbers, including typical latencies and common data sizes. You don't need to memorize every latency figure for this lesson, but internalizing the 'Common Data Size Assumptions' is very useful.
Review the table under 'Essential Numbers to Know'. Focus on the 'Common Data Size Assumptions' like the size of a character, URL, text post, and image. These will be your building blocks.
Here's a handy visual cheat-sheet that summarizes some of these quick calculations.
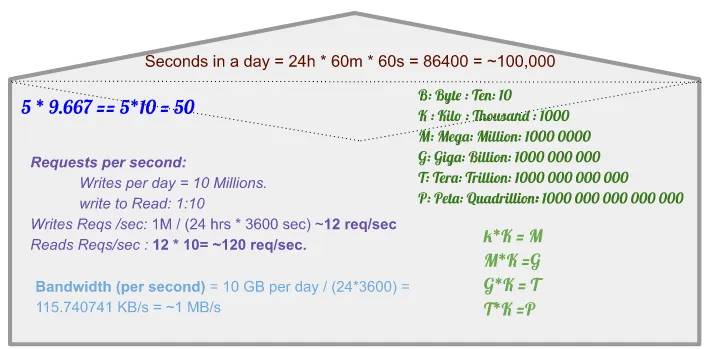
A Step-by-Step Guide to Estimation
Let's follow a structured approach: first, we'll estimate traffic, then storage, and finally bandwidth.
Step 1: Estimate Traffic (QPS)
Your first goal is to figure out the load on the system in terms of Queries Per Second (QPS). We almost always design for the peak load, not the average.
The Formulas:
- Average QPS =
(Total Daily Requests) / 86,400 seconds- Total Daily Requests =
Daily Active Users (DAU) * Average Requests per User
- Total Daily Requests =
- Peak QPS =
Average QPS * Peak Multiplier- Traffic is rarely uniform. A
2xto5xmultiplier is a common assumption to account for peak hours.
- Traffic is rarely uniform. A
- Read vs. Write QPS:
Peak Read QPS = Peak QPS * (% Reads)Peak Write QPS = Peak QPS * (% Writes)
Let's watch a clear, worked example of these calculations.
Capacity Planning and Estimation | System Design for Beginners
Shiran Afergan provides a very clear, step-by-step walkthrough of estimating traffic for a hypothetical Pastebin-like service. This demonstrates how to go from DAU to distinct read and write QPS.
Watch the 'Traffic Estimation' section of the video (02:03 - 06:04). Notice how the presenter clearly states assumptions (DAU, write percentage, read/write ratio) and aggressively rounds numbers to simplify the math.
Pro Tip: Use Scientific Notation
Dealing with millions of users and thousands of seconds can lead to unwieldy numbers. Converting to scientific notation (powers of 10) makes multiplication and division much simpler.
- 1 million =
- 100,000 seconds = seconds
Dividing by is simply . This is much easier than doing 1,000,000 / 100,000.
Back-Of-The-Envelope Estimation / Capacity Planning
The ByteByteGo video we saw earlier has a great segment explaining this technique. It's a powerful tool to have in your arsenal for performing these calculations quickly and accurately on a whiteboard.
Watch the segment from 03:42 to 05:00 to see how to use scientific notation and group powers of 10 to simplify large-number calculations.
Step 2: Estimate Storage Requirements
Once you know your write traffic, you can estimate storage.
The Formulas:
- Data Added Per Day =
(Total Daily Writes) * (Average Size of an Object) - Total Storage =
(Data Added Per Day) * 365 * (Number of Years for Retention) - Total Storage with Replication =
Total Storage * Replication Factor- Crucial: Never forget replication! Data is almost always replicated for durability and availability. A replication factor of
3xis a standard assumption.
- Crucial: Never forget replication! Data is almost always replicated for durability and availability. A replication factor of
Let's see an example that involves different types of media, which is a common scenario.
Back-Of-The-Envelope Estimation / Capacity Planning
This segment from the ByteByteGo video calculates the storage needed for tweets containing pictures and videos. It's an excellent example of how to handle different object sizes and use shortcuts in your estimation.
Watch the storage estimation example from 05:43 to 08:11. Pay close attention to how assumptions are made for the percentage of tweets with media, average file sizes, replication, and data retention.
Step 3: Estimate Bandwidth
Bandwidth refers to the data transfer rate your network needs to support. It's derived directly from your QPS and object size estimates.
- Ingress (Incoming Bandwidth): This is the data coming into your system, primarily from writes.
- Formula:
Write QPS * Average Request Size
- Formula:
- Egress (Outgoing Bandwidth): This is the data leaving your system, primarily from reads.
- Formula:
Read QPS * Average Response Size
- Formula:
For example, if your peak write QPS is 500 writes/sec and the average upload size is 100 KB, your ingress requirement is 500 * 100 KB = 50 MB/s.
Capacity Planning and Estimation | System Design for Beginners
Let's return to the video by Shiran Afergan for a quick and clear explanation of how to calculate bandwidth.
Watch the brief 'Bandwidth' section (10:41 - 11:38). It's a straightforward application of the formulas using the QPS and storage numbers already calculated.
The Final, Crucial Step: The Sanity Check
After you've run the numbers, take a moment to step back and ask: "Does this make sense?" This is a key differentiator for senior candidates. It shows you're not just mechanically following a formula.
Back To Envelope Or Capacity Estimation - Wisdom - GitBook
This article provides an excellent checklist for sanity-checking your estimates. Internalizing these questions will help you catch mistakes and demonstrate a higher level of thinking.
Read the section 'Don't Forget to Sanity-Check Your Estimates!'. Focus on the four checks: Order-of-Magnitude, Dimensional Analysis, Bottleneck Identification, and Comparison to Known Systems.
If you calculate that a simple photo-sharing app needs exabytes of storage, you've likely mixed up your units (e.g., KB vs. MB). Catching this yourself is far better than having the interviewer point it out.
Conclusion
In this lesson, you've learned the systematic process for performing back-of-the-envelope calculations. This isn't just about math; it's about building a quantitative foundation for your system design. The estimates you generate will justify your architectural choices in the next stages of the interview.
Key Takeaways:
- State Assumptions Clearly: Always start by stating your assumptions for DAU, usage patterns, and data sizes.
- Approximate Aggressively: Round numbers like seconds in a day () to simplify your calculations.
- Follow the Structure: Calculate QPS (peak, read/write split), then Storage (with retention and replication), and finally Bandwidth (ingress/egress).
- Design for the Peak: Your system must handle the busiest moments, so always apply a peak multiplier to your average traffic.
- Sanity-Check Everything: Step back and evaluate if your numbers are reasonable for the scale of the system you're designing.
In our next lesson, "Create a high-level design diagram including major components and APIs," we will take these estimates and begin to sketch our architecture. Your QPS numbers will tell you that you need a load balancer, and your storage estimates will inform your choice of database and storage systems. This is where the design starts to take shape.