Hello! Welcome to your fourth lesson in the module "Measuring the Unconscious Consumer."
In our last few lessons, we've built a solid toolkit. We started with eye-tracking to see where people look. Then, we used Facial Action Coding System (FACS) to understand what they feel by analyzing their expressions. These tools tell us a lot about attention and emotion.
Today, we go a step further and look directly inside the brain. Our goal is to describe the function of Electroencephalography (EEG) in measuring cognitive load and engagement.
This might sound complex, but the core idea is simple: to measure a person's mental effort and level of interest in real-time. For someone in your field, this is incredibly valuable. It allows you to move beyond guessing whether a message is clear or an ad is interesting, and instead, measure it with objective data. Mastering this concept will empower you to explain with confidence why one marketing asset works better than another, based on how the brain itself responds.
1. What is EEG? Listening to the Brain's Electrical Buzz
At its core, Electroencephalography (EEG) is a method for listening to the electrical activity of the brain. The name itself is a great way to explain it to others:
- Electro-: Pertaining to electricity.
- -Encephalo-: Pertaining to the brain.
- -Gram: Meaning "a written record."
So, EEG is simply a written record of the brain's electrical signals.
How does it work? Your brain cells, or neurons, communicate using tiny electrical impulses. While the signal from a single neuron is too small to detect from the outside, when millions of neurons fire together in a coordinated way, they create an electrical field strong enough to be measured by placing sensors (electrodes) on the scalp.
Imagine you're outside a large football stadium. You can't hear one person's conversation, but you can easily hear the collective roar of the crowd. EEG is like placing microphones around the stadium to gauge the crowd's overall reaction—are they excited, bored, or paying close attention?
To get a more scientific grounding on this, let's watch a short video that explains the underlying principles.
EEG (Electroencephalogram) Explained
The video 'EEG (Electroencephalogram) Explained' from Zachary Cortex provides a fantastic introduction to how EEG works, starting from the level of brain cells.
Please watch from the beginning to 03:25. The video explains how the collective activity of brain cells creates detectable electrical signals on the scalp. Don't worry about memorizing terms like 'dipole'; focus on the main idea that synchronized neuron activity is what EEG measures.
The key takeaway is that EEG is a non-invasive technique that measures the summed electrical output of large populations of neurons, giving us a real-time view of brain activity.
2. From Squiggly Lines to Mental States: Brainwave Frequencies
An raw EEG recording looks like a set of squiggly lines, which isn't very useful on its own. To make sense of it, researchers analyze the frequency of these waves—that is, how many times they oscillate per second. Different frequencies, or "brainwave bands," are strongly associated with different mental states.
This is the key to translating EEG data into psychological insights. Let's learn about the main frequency bands.
EEG (Electroencephalogram) Explained
We'll return to the same video, which now breaks down the different types of brainwaves.
Please watch from 04:11 to 05:11. This section introduces the five key frequency bands and the mental states they're typically associated with.
Here is a summary of those brainwave bands, which is useful to have for reference:
| Band | Frequency (Hz) | Associated Mental State | Marketing Analogy |
|---|---|---|---|
| Delta | 0.5 - 4 Hz | Deep, dreamless sleep | A consumer who is completely tuned out |
| Theta | 4 - 8 Hz | Drowsiness, deep relaxation, high cognitive load | A state of deep immersion or intense mental effort |
| Alpha | 8 - 13 Hz | Relaxed wakefulness, passive attention ("autopilot") | Someone passively watching TV, not actively engaged |
| Beta | 13 - 35 Hz | Active thinking, focus, alertness | An actively engaged consumer comparing product features |
| Gamma | > 35 Hz | High-level information processing, problem-solving | A "lightbulb moment" of understanding a concept |
Understanding these bands is the first step to applying EEG to marketing questions. For instance, if you show someone an ad and their alpha waves increase, it's a good sign they're zoning out. If their beta waves increase, they're actively processing it.
3. Measuring Cognitive Load and Engagement
Now we get to the core of today's lesson: using these brainwave insights to measure two crucial marketing metrics: cognitive load and engagement.
Cognitive Load: "How hard am I having to think?"
Cognitive load refers to the amount of mental effort a person is using to complete a task.
- High cognitive load isn't always bad—it can mean deep concentration. But in marketing, it often signals that something is confusing, poorly designed, or too complex (e.g., a complicated website checkout process).
- Low cognitive load can mean a task is easy and intuitive.
Research in neuromarketing has found a reliable brain signature for cognitive load. As noted in the academic literature, an increase in Theta band activity, particularly over the frontal areas of the brain, is often used as an indicator of higher cognitive load.
So, when explaining this, you can say: "We measured viewers' brain activity as they watched the ad. During the scene explaining the product's features, we saw a spike in theta waves, which is the brain's signature for high mental effort. This tells us the explanation was likely too confusing for the audience."
Engagement: "Am I interested and drawn in?"
Engagement is a broader concept that combines attention, emotion, and motivation. An engaged consumer is mentally "leaning in," while a disengaged one is "leaning out."
EEG can measure engagement in several ways:
- Attention & Focus: A shift from slower alpha waves to faster beta waves often indicates a person is moving from passive viewing to active mental engagement.
- Approach vs. Avoidance: A commonly used metric is frontal alpha asymmetry. In simple terms, greater activity in the left frontal lobe (relative to the right) is often associated with "approach" motivation—interest and a desire to move towards something. Greater activity on the right is linked to "withdrawal" or "avoidance" motivation. This can tell you if a product or message is attractive or off-putting.
- Emotional Arousal: Certain ratios of different brainwaves (like the theta/beta ratio) can also be used as a proxy for emotional arousal or excitement.
The article "Using EEG in Market Research" provides a great overview of how these concepts are applied in practice.
Using EEG in Market Research: A Beginner's Guide
This article from EMOTIV, a leading EEG technology company, explains how EEG is used to get objective data on what captures attention and drives choice.
Please read the sections titled 'Measure Brain Activity in Real Time' and 'Analyze Decision-Making and Attention Patterns'. Focus on how EEG's high-speed measurement is ideal for tracking cognitive load and attention second-by-second.
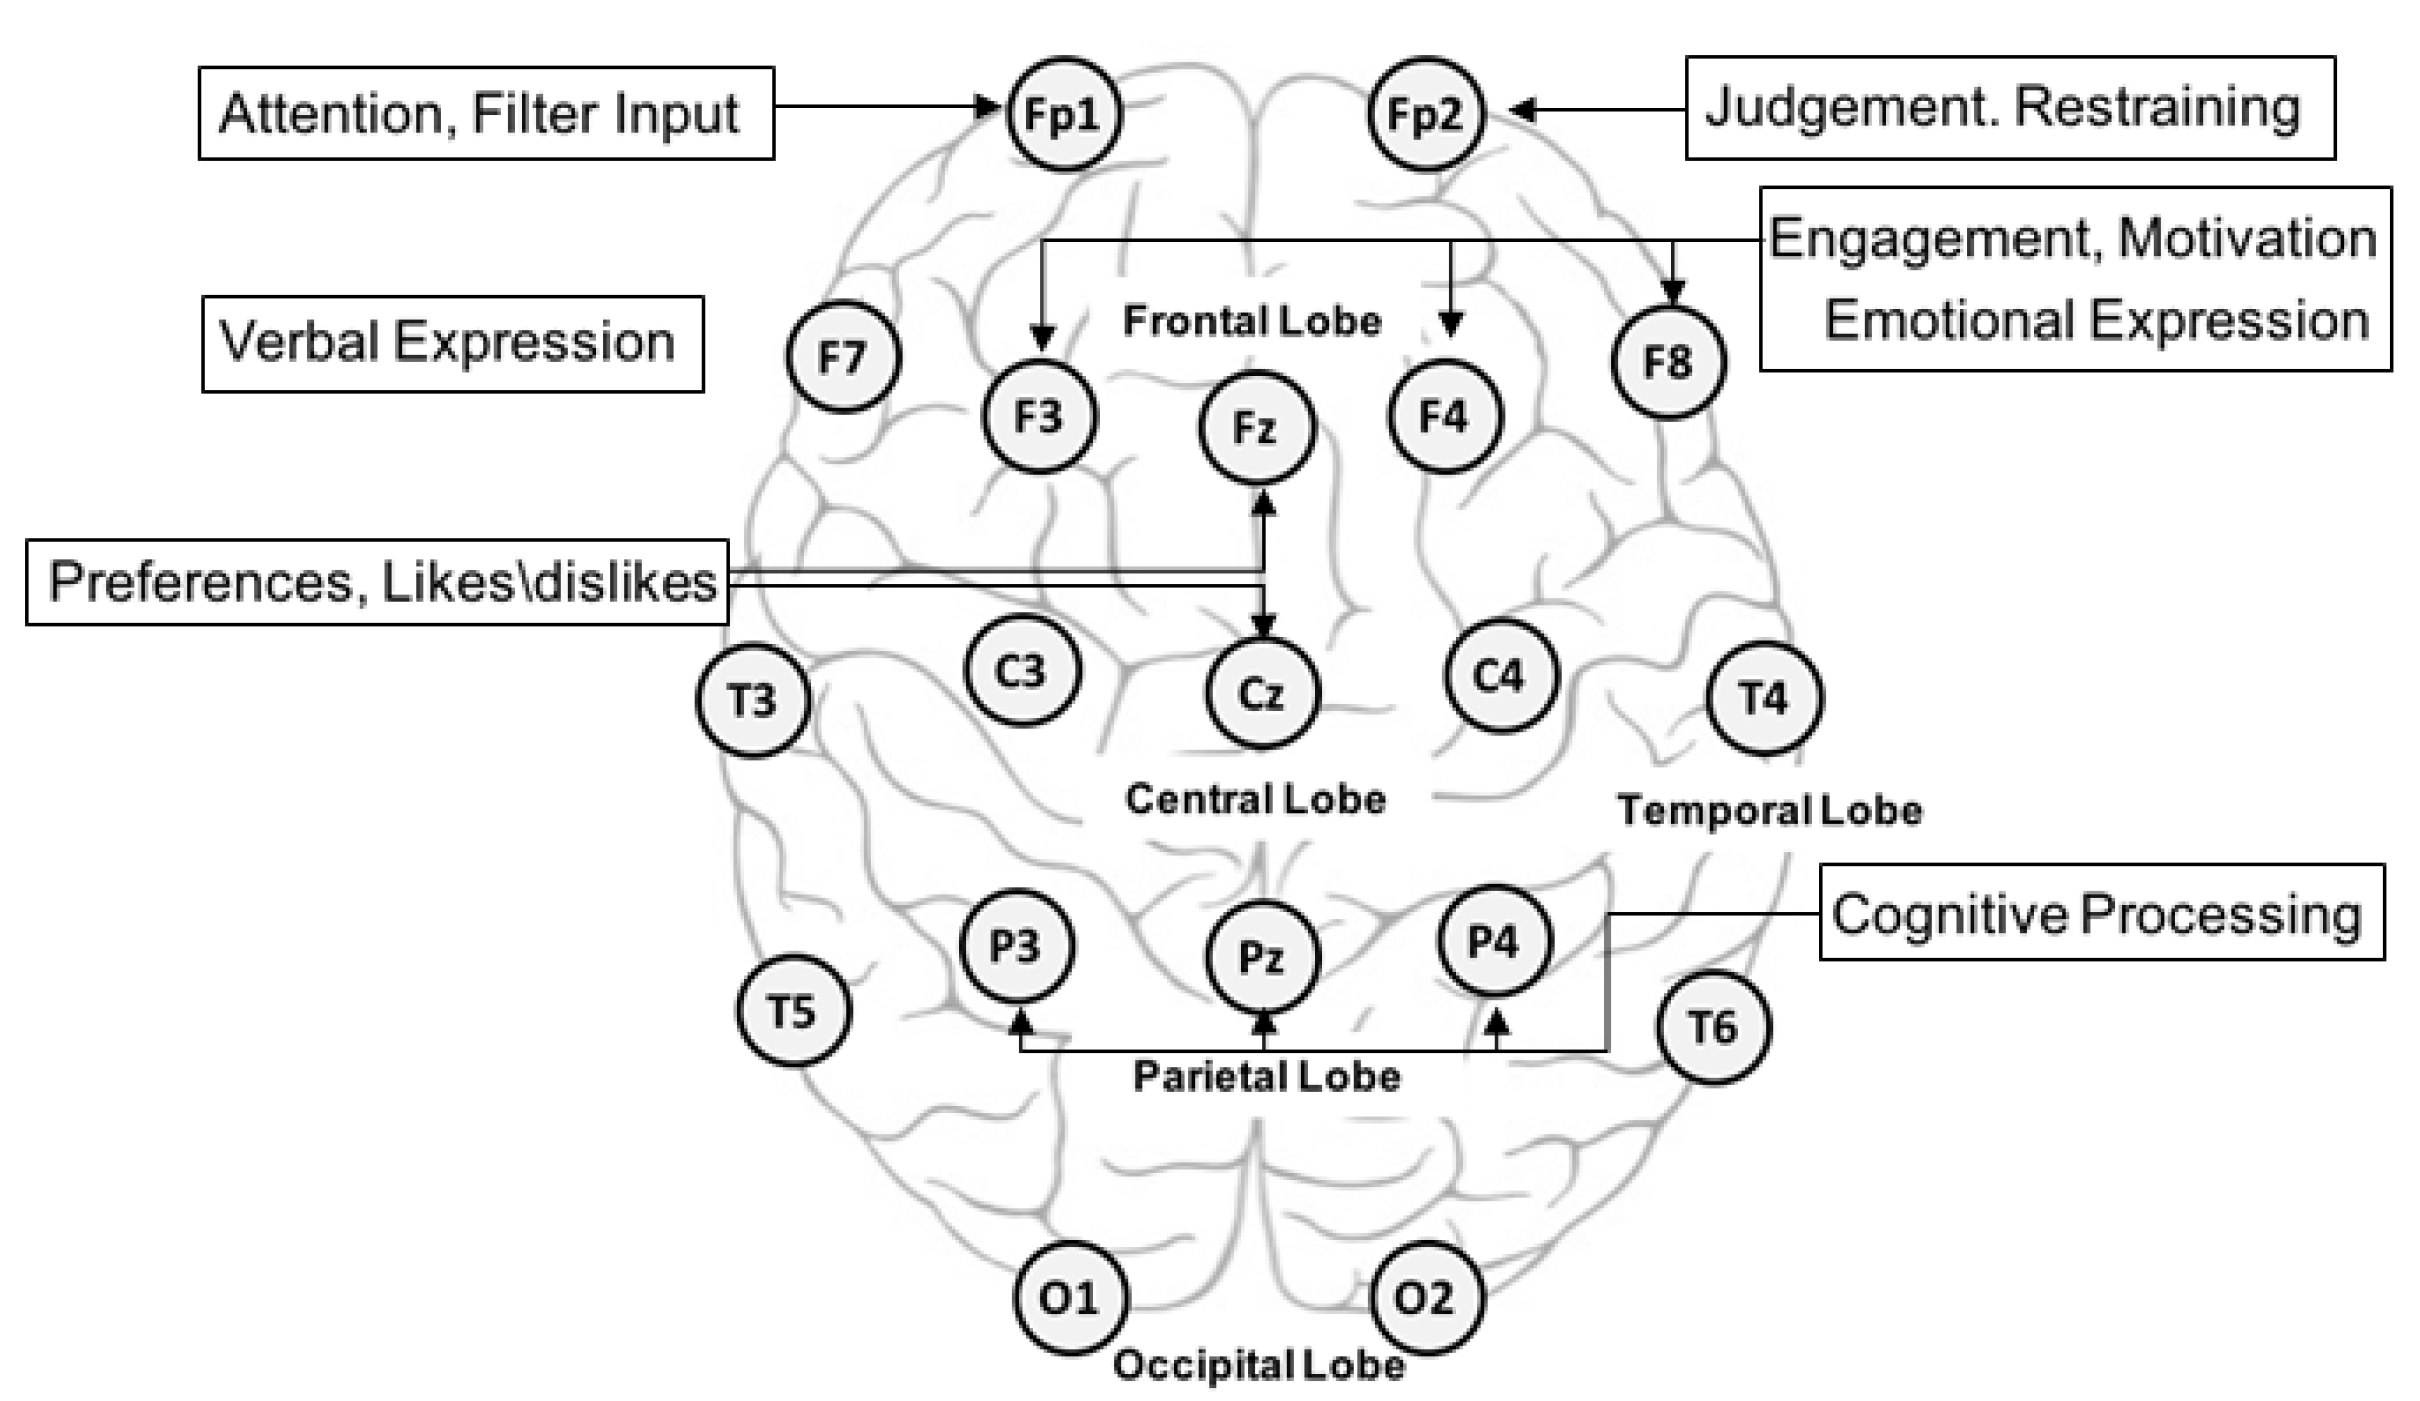
To bring this all together, look at the image below. It shows the standard placement of EEG electrodes and connects different brain regions to the very functions we're discussing.
Test your understanding!
You are testing two website designs for a new tech product.
- Design A is minimalist with a lot of visuals and very little text.
- Design B is text-heavy, with detailed technical specifications listed upfront.
The EEG results show that users viewing Design B have significantly higher theta band power over their frontal lobes compared to users viewing Design A. How would you interpret this result and what recommendation would you make?
Show answer
The higher theta band power for Design B indicates a much higher cognitive load. This means users had to exert significantly more mental effort to understand the information presented.
Interpretation & Recommendation: While some effort is expected for a technical product, the high cognitive load suggests Design B is likely overwhelming or confusing for most users on their first visit. Design A, with its lower cognitive load, is probably easier to process. The recommendation would be to proceed with a design closer to A, but perhaps integrate some of the essential technical details from B in a more digestible format (e.g., in a clickable "Learn More" section) to avoid cognitive overload.
Conclusion
Today, we've unpacked the function of EEG as a powerful neuromarketing tool. We've gone from the basic science of brainwaves to its practical application in measuring what's happening inside a consumer's mind.
Key Takeaways:
- EEG measures the electrical activity of the brain using non-invasive scalp sensors, offering a real-time view of mental states.
- Brain activity is analyzed in frequency bands (like Alpha, Beta, Theta), which correspond to different states like relaxation, focus, or mental effort.
- Cognitive Load, or mental effort, is often measured by tracking Theta wave activity. This helps identify if a marketing message is confusing or difficult to process.
- Engagement is measured using multiple EEG signals, including shifts from Alpha to Beta waves (indicating focus) and frontal alpha asymmetry (indicating approach/avoidance motivation).
Your ability to explain this process is a key skill. You can now confidently state that neuromarketing research can measure not just what people look at (eye-tracking) or how they emote (FACS), but also how hard their brain is working and how engaged they truly are.
Preview of Next Lesson:
While EEG is great for measuring cognitive states, another key dimension of emotion is arousal—the intensity of the feeling. How do we measure that jolt of excitement from a thrilling ad or the subtle stress of a difficult choice? In our next lesson, we'll explore Galvanic Skin Response (GSR), a technique that measures emotional arousal by tracking changes in skin sweat.