Hello! Welcome back to our journey into analytical mechanics.
In our last lesson, we learned the "recipe" for solving mechanics problems using the Hamiltonian formalism. We saw that this approach transforms a system's dynamics into a set of first-order differential equations governing its evolution in phase space. We ended with a preview of how this evolution can be visualized as a "flow" on a geometric landscape defined by the Hamiltonian.
Today, we will master the art of creating and reading these geometric maps. Our learning outcome is to construct and interpret phase space diagrams for simple Hamiltonian systems. This powerful skill allows us to understand the complete qualitative behavior of a system—identifying equilibria, oscillations, and other types of motion—without needing to solve the differential equations for every possible starting condition.
1. From Hamiltonian to Phase Portrait
Let's start by formalizing the connection between the Hamiltonian and the phase portrait. For a system with one degree of freedom, the phase space is a 2D plane with coordinates . A phase portrait is a drawing of the trajectories (or "flow lines") that a system can follow in this space.
For a conservative system, the Hamiltonian does not explicitly depend on time, which means the total energy is conserved. We proved this in the last lesson: if , then . This has a profound geometric consequence:
A system's trajectory in phase space must always stay on a curve of constant energy.
Therefore, the phase portrait is simply the set of contour lines (or level sets) of the function . To draw the portrait, we just need to plot the curves for various values of energy .
The direction of flow along these contours is given by Hamilton's equations, which define a "velocity" vector, or flow vector, at every point in phase space:
As we saw previously, this vector is always tangent to the contours of constant , ensuring the system flows along them.
PHYS2100: Hamiltonian dynamics and chaos
These course notes provide a concise and rigorous explanation of phase portraits and their connection to the Hamiltonian.
Please read Section 2.1 'Flow vector field' and Section 2.2 'Phase portraits' (pages 4-7). Focus on the proof in Eq. (2.13) that shows why H is constant for a time-independent Hamiltonian, and the argument that this means trajectories are lines of constant H.
2. How to Construct a Phase Portrait: A Systematic Method
While we could just plot , a more insightful method involves analyzing the qualitative features of the landscape first. The most important features are the points where the flow stops—the equilibrium points.
The process, summarized nicely in the resource you just read (Section 2.4.5), is as follows:
-
Find Fixed Points: These are the equilibrium points of the system, where it can remain forever at rest. The flow vector is zero here: and . Using Hamilton's equations, this means:
For a typical mechanical system with , this simplifies to and . The fixed points occur where the momentum is zero and the particle is at a minimum or maximum of the potential energy. -
Determine Stability (Linearization): To understand the flow near a fixed point, we linearize Hamilton's equations. This process classifies the fixed point's stability. For our purposes, we find two main types:
- Elliptic Fixed Point (Center): Trajectories near this point are closed loops (ellipses). This corresponds to a stable equilibrium (a minimum of the potential energy). If you nudge the system slightly, it will oscillate around the equilibrium.
- Hyperbolic Fixed Point (Saddle): Trajectories approach the point along one direction and are flung away along another. This corresponds to an unstable equilibrium (a maximum of the potential energy). If you nudge the system, it will move far away.
-
Sketch Global Trajectories: Draw the contour lines of constant energy, using the fixed points as anchors. The special trajectory that passes through a hyperbolic fixed point is called a separatrix. It is extremely important because it separates regions of phase space with qualitatively different types of motion.
Let's apply this method.
3. Case Study 1: The Simple Harmonic Oscillator (SHO)
The SHO is the simplest and most fundamental oscillatory system. Its Hamiltonian is:
Let's analyze it step-by-step.
-
Fixed Points:
There is a single fixed point at . This corresponds to the mass being at rest at its equilibrium position.
-
Stability: The potential has a minimum at , so we expect this to be a stable, elliptic point.
-
Global Trajectories: The trajectories are curves of constant energy :
This is the equation of an ellipse centered at the origin. For different energies, we get a family of nested ellipses. The direction of flow is clockwise, which you can verify from Hamilton's equations (if , then , so becomes negative).

The interpretation is clear: for any initial energy, the system undergoes bounded, periodic motion (oscillation) around the stable equilibrium point at the origin.
4. Case Study 2: The Simple Pendulum
The pendulum is the classic example showcasing more complex behavior. As derived in the last lesson, its Hamiltonian is:
where is the moment of inertia, is the angle from the bottom, and is the angular momentum.
-
Fixed Points:
- for integer .
Due to the periodicity of the angle, there are two physically distinct fixed points: - : Pendulum hanging motionless at the bottom.
- : Pendulum balanced perfectly upright.
-
Stability:
- At , the potential is at a minimum. This is a stable equilibrium (an elliptic point).
- At , the potential is at a maximum. This is an unstable equilibrium (a hyperbolic point).
-
Global Trajectories: Sketching the contours of gives the full picture.
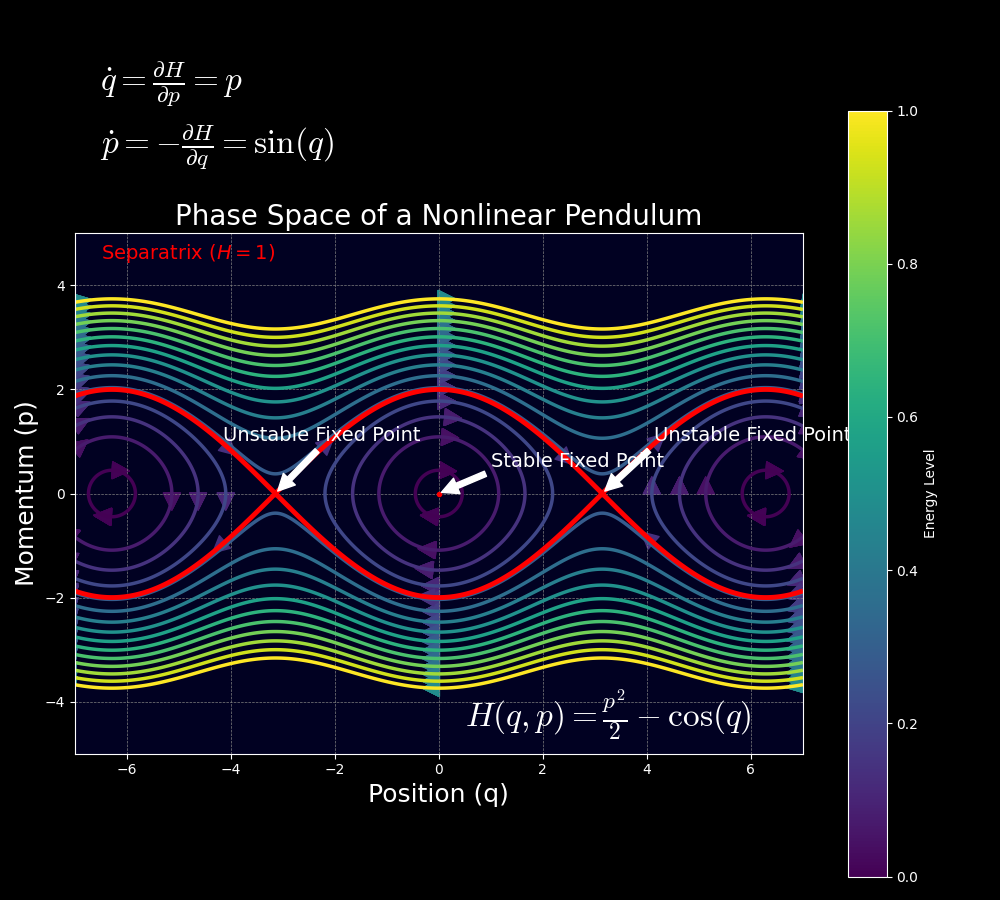
Interpreting the Pendulum's Phase Portrait:
- Closed Loops (inside the separatrix): These correspond to low energy states where the pendulum oscillates back and forth around the stable equilibrium at . This motion is called libration. The trajectories are distorted ellipses, not perfect ellipses like the SHO, because the pendulum is a nonlinear oscillator.
- Wavy Lines (outside the separatrix): These are high energy states where the momentum is always large enough to carry the pendulum "over the top". This motion is called rotation. The pendulum continuously spins in one direction (either clockwise or counter-clockwise).
- The Separatrix: This is the critical curve (shown in red in the image above) that connects the unstable fixed points at . It corresponds to the exact energy required for the pendulum to start at the bottom and just barely reach the top, where it comes to rest momentarily. It separates the two distinct types of motion.
Pendulum & Harmonic Oscillator Phase Space Trajectories with Lagrangian & Hamiltonian Mechanics
This video provides an excellent dynamic visualization and explanation of the pendulum's phase portrait, highlighting the features we just discussed.
Watch from 22:29 to 31:59. The video first sets up the Hamiltonian and Hamilton's equations for the pendulum (which will be a good review). Then, it masterfully explains the meaning of the different trajectories (closed orbits, separatrices, wavy lines) and the stable/unstable equilibrium points.
5. Advanced Example: Particle in a Cubic Potential
Let's apply our method to a problem you might encounter in a dynamics competition. Consider a particle of mass moving in a potential . (This is a slightly different potential from the one in the video, but the analysis is very similar).
The Hamiltonian is .
Hamilton's equations are and .
-
Fixed Points:
- or .
We have two fixed points: and .
-
Stability:
- Near , the potential , which is a minimum. This is a stable (elliptic) point.
- Near , the potential has a maximum. This is an unstable (hyperbolic) point.
-
Global Portrait: We expect to see closed loops around and a saddle structure at . The separatrix will emerge from the unstable point.
The following video walks through the complete construction of a very similar phase portrait. It uses a slightly different language (working with position and velocity ) but the method of finding fixed points and linearizing is precisely what we are doing. This is an excellent demonstration of the general applicability of these techniques in dynamical systems.
Drawing Phase Portraits for Nonlinear Systems
Watch this video to see an expert construct a phase portrait for a nonlinear system from the ground up. It beautifully illustrates the process of finding fixed points, linearizing to determine their type, and then stitching the local pictures together to form the global portrait.
Watch from the beginning to 22:07. Pay close attention to how the analysis is broken down: finding fixed points, using the Jacobian matrix to linearize, analyzing eigenvalues to classify the points as a center or a saddle, and finally using physical intuition (conservation of energy) to draw the global picture.
Test your understanding!
Consider the phase portrait from the video you just watched (for the potential ).
- What does a trajectory that starts at look like physically?
- What happens physically if the particle starts exactly at ?
- What happens if the particle starts at with an infinitesimally small positive velocity ?
Show answer
- A trajectory starting at is inside the closed loop (the "cat's eye"). The particle is in a potential well and doesn't have enough energy to overcome the potential hill at . Physically, it will oscillate back and forth around the stable equilibrium at .
- This is the unstable fixed point. Physically, the particle is perfectly balanced on top of the local potential energy maximum. It will remain there indefinitely if undisturbed.
- This starting point is just "outside" the separatrix in the upper half-plane. The particle has slightly more energy than the energy of the separatrix. It will roll off the potential hill to the right and, since the potential decreases indefinitely for , it will accelerate away and never return. Its position will go to .
Conclusion
Today we transformed the abstract concept of phase space into a practical tool for analyzing physical systems. By constructing and interpreting phase portraits, we can gain deep, qualitative insights into the dynamics governed by a Hamiltonian.
Key Takeaways:
- For conservative systems, trajectories in phase space are the contour lines of the Hamiltonian .
- A systematic way to construct a phase portrait is to first find the fixed points () and then analyze their stability by linearizing the dynamics around them.
- Elliptic fixed points correspond to stable equilibria (potential minima) and are surrounded by closed orbits (oscillations).
- Hyperbolic fixed points correspond to unstable equilibria (potential maxima) and give rise to separatrices—special trajectories that divide the phase space into regions of qualitatively different motion.
Preview of the Next Lesson:
Our analysis today relied on linearizing Hamilton's equations around fixed points. This is a specific application of a much broader mathematical field: the theory of Ordinary Differential Equations (ODEs). In our next module, "Mathematical Methods for Physics," we will begin by formally learning how to solve the very types of first and second-order ODEs that arise in mechanics. The phase portraits you learned to draw today will serve as a powerful geometric guide to understanding the solutions you will soon learn to find analytically.