Hello! Welcome back to your course on Docker.
In our last lesson, you successfully set up a secure private registry and pushed your first image to it. That was a critical step in building a professional software supply chain. Now that you're managing images, the next logical step is to learn how to look "under the hood" and understand their composition and configuration.
Today's learning outcome is to inspect image layers and container configurations using docker inspect. This command is your diagnostic multitool for Docker. As a DevOps engineer, you'll find docker inspect indispensable for debugging, automation, and security analysis. It allows you to programmatically pull any piece of information Docker knows about an object, which is perfect for scripting and integration with other tools.
By the end of this lesson, you'll be able to dissect any Docker container or image to find its IP address, port mappings, environment variables, and even the individual layers that make up its filesystem.
1. What's Inside a Docker Object?
Before we start inspecting, it's important to remember that Docker images and containers are not monolithic blobs. They are complex objects with rich metadata. An image, for instance, is composed of a series of read-only layers.
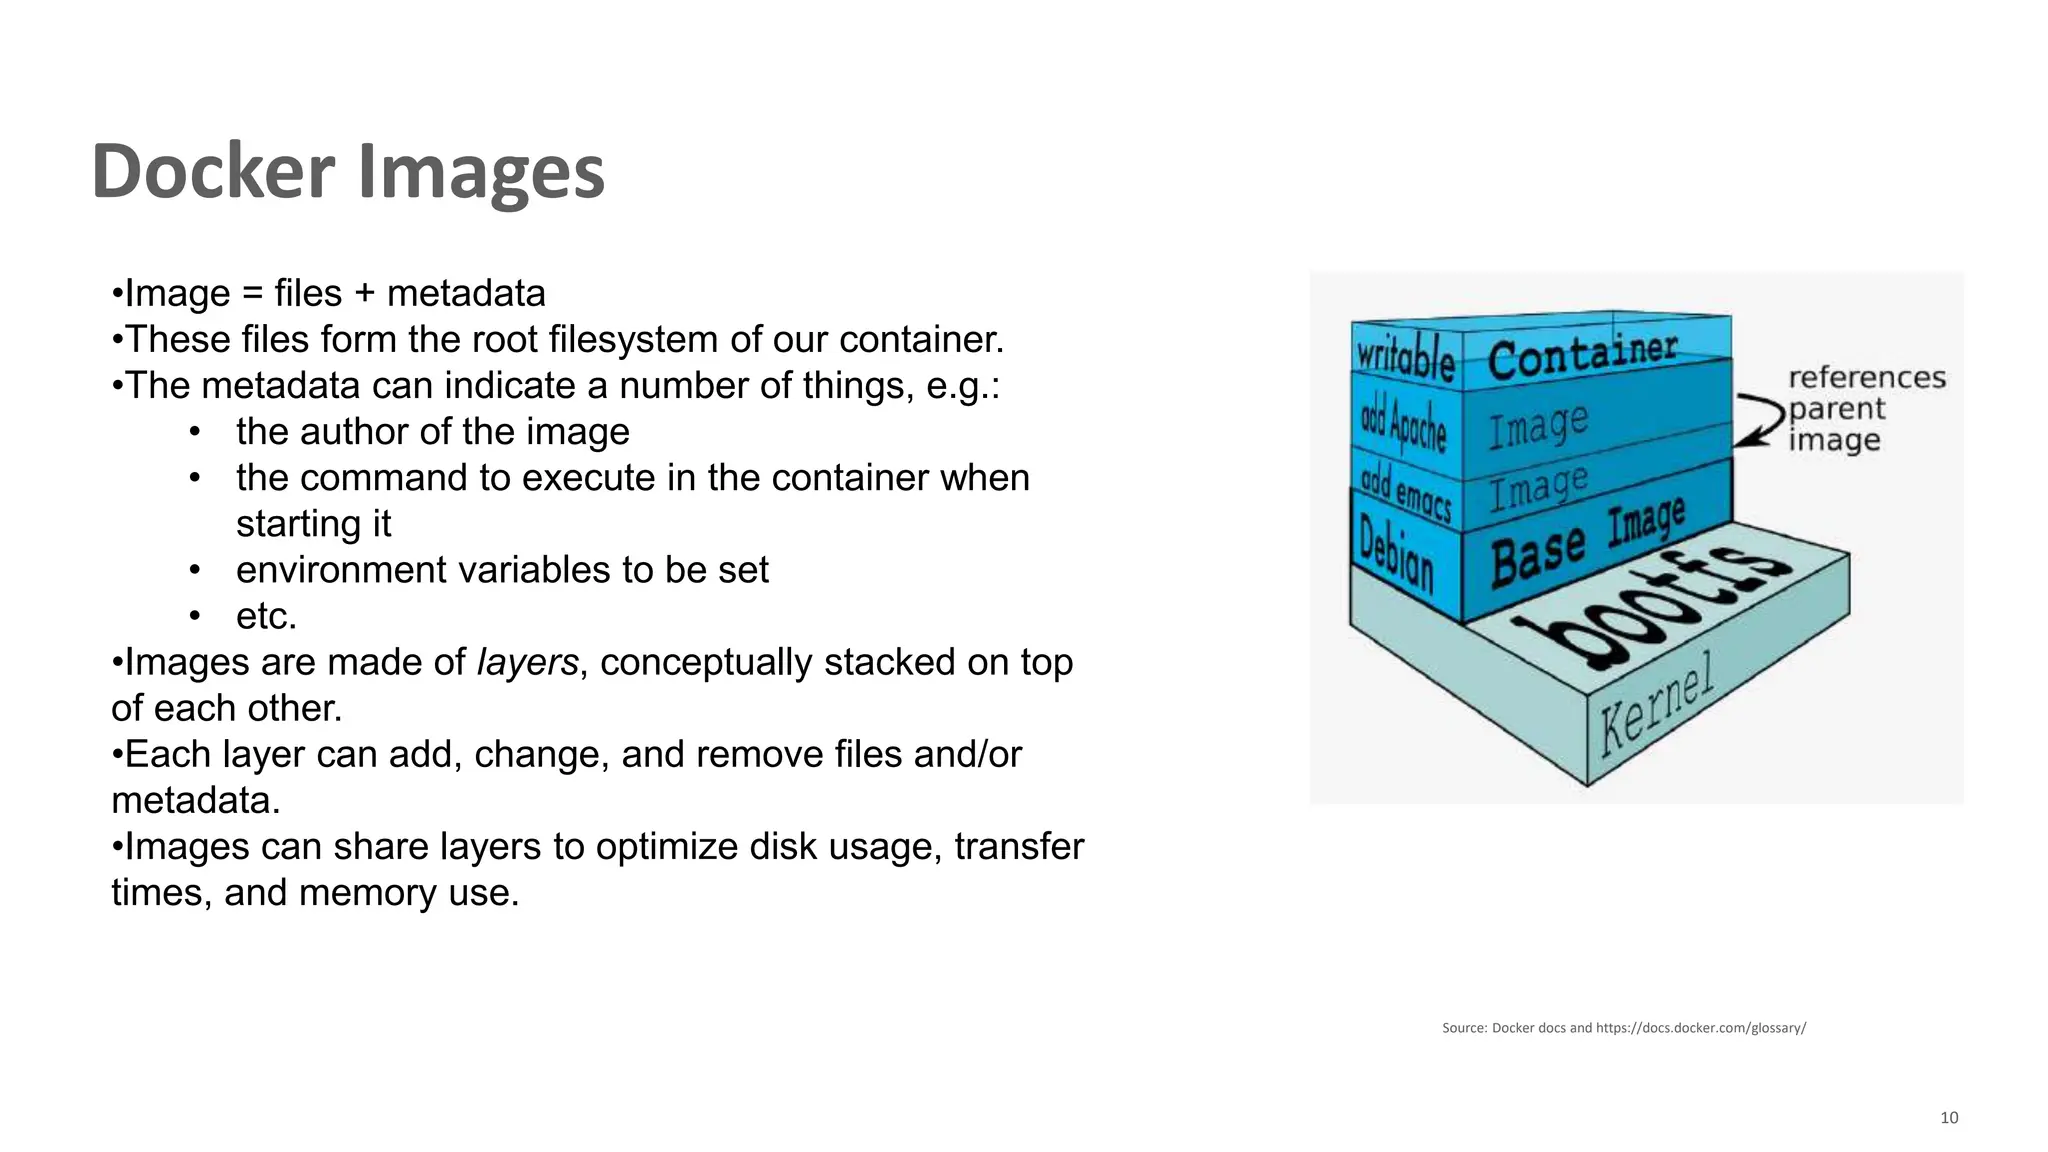
The docker inspect command gives us a low-level view of all this data in a structured JSON format. Let's see what that looks like.
First, let's make sure you have a container running. We'll use a simple nginx container:
docker run -d --name web -p 8080:80 nginx
Now, run the inspect command on this new container:
docker inspect web
You'll see a very large JSON output. It contains everything from the container's state and process ID to its network settings and volume mounts. Manually sifting through this is difficult, which brings us to the real power of docker inspect: filtering.
To get a feel for how to navigate this output and start filtering, let's watch a short video.
Using Docker Inspection like a Boss
This video from DevOps Journey provides a great introduction to docker inspect. It shows how to handle the large JSON output and introduces the concept of filtering to extract specific pieces of information.
Watch from the beginning to 03:11. Pay attention to how the presenter runs the command, redirects the output to a JSON file for easier viewing, and identifies key information like hostname and network settings within the JSON structure.
2. Precise Data Extraction with Go Templates
As the video demonstrated, you rarely want the entire JSON blob. The --format (or -f) flag allows you to provide a Go template to extract exactly the data you need. Since Docker is written in Go, it uses Go's native templating language.
The syntax uses {{ }} to enclose expressions. You access fields in the JSON using dot notation, starting from the root.
For example, to get the IP address of our web container:
docker inspect -f '{{.NetworkSettings.IPAddress}}' web
Note: For containers connected to multiple networks, the IP address is nested deeper. We'll see how to handle that soon.
Let's explore this with a few more practical examples.
Docker Inspect Explained: A Step-by-Step Guide
The article 'Docker Inspect Explained' provides a thorough text reference for the command's syntax and its powerful formatting options. It's a great resource to complement the video.
Read the introduction, 'Options,' and 'Examples' sections. Focus on the basic syntax and how to use the -f option with Go templates to access nested data like {{.Config.Volumes}}.
Now that you have the basic idea, let's see how to apply it to extract more complex information.
Looping Through Collections
Some fields, like environment variables or network settings, are arrays or maps. You can iterate over them using range.
The following video section demonstrates how to do this to extract network information. This is a very common task when debugging connectivity issues between containers.
Using Docker Inspection like a Boss
Let's continue with the 'Using Docker Inspection like a Boss' video. This next part shows you how to use simple filters and then dives into a more advanced example using a range loop to extract all IP and MAC addresses from a container's network interfaces.
Watch from 03:11 to 10:09. Observe how the JSON structure seen in the file editor directly maps to the Go template syntax (e.g., .NetworkSettings.Networks).
Test your understanding!
The nginx image we are using has an environment variable NGINX_VERSION. Write a single docker inspect command to extract the value of just this environment variable from the running web container.
Hint: Environment variables are stored as an array of strings in the format KEY=VALUE under .Config.Env. You'll need to use a range loop and likely some shell tools like grep or awk to isolate the specific variable. A pure Go template solution is more complex, so combining it with shell tools is a common and practical approach.
Show answer
There are a few ways to do this. A practical approach combines inspect with grep:
docker inspect -f '{{range .Config.Env}}{{println .}}{{end}}' web | grep NGINX_VERSION
This command tells docker inspect to loop through all environment variables and print each one on a new line. Then, grep filters that output to show only the line containing NGINX_VERSION.
3. Inspecting Image Layers: A Deeper Dive
So far, we've focused on containers. But docker inspect is equally powerful for analyzing the images themselves. This is where your DevOps and Linux expertise comes in handy, as we can connect the abstract idea of layers to the actual files on the host system.
First, a command that complements inspect is docker history. It gives a high-level overview of the layers in an image and the Dockerfile instructions that created them.
docker history nginx:latest
You'll see a list of layers, their creation dates, and their sizes. This gives you a quick idea of what makes up the image.
Now, let's use docker inspect to get the full story.
Inspect your Docker image like a Pro
This article, 'Inspect your Docker image like a Pro', shows how to combine docker history and docker inspect to perform a deep analysis of an image's structure. It's particularly useful because it explains how to find the physical location of layers on your disk.
Read the sections 'Docker image history', 'Docker inspect' (focusing on the 'RootFS' part), and 'Use OverlayFS to inspect layer files'. Pay close attention to how the GraphDriver.Data from the inspect output can be used to locate layer files in /var/lib/docker/overlay2.
As the article explains, running docker inspect nginx:latest and looking at the GraphDriver.Data gives you LowerDir, UpperDir, and MergedDir. These correspond directly to the OverlayFS storage driver that Docker uses on most Linux systems.
The LowerDir contains a colon-separated list of paths to the read-only image layers. The UpperDir is the container's writable layer, and MergedDir is the unified view that the container sees.
This means you can actually cd into these directories (you'll need sudo) on your Docker host and see the exact files that constitute each layer. For a DevOps engineer troubleshooting a "works on my machine" problem or investigating a mysterious file in a container, this is an incredibly powerful technique.
Conclusion
You have now mastered docker inspect, a cornerstone command for any Docker power user. It's your window into the internal state of all Docker objects.
Key Takeaways:
docker inspectprovides detailed, low-level metadata about images, containers, volumes, and networks in JSON format.- The raw JSON output is verbose; the real power lies in using the
--format(-f) flag with Go templates to extract specific data. - You can access nested fields with dot notation (e.g.,
{{.NetworkSettings.IPAddress}}) and iterate over lists withrange. - For images,
inspectcan reveal the cryptographic ID of each layer (RootFS) and even the location of layer files on the host filesystem (GraphDriver.Data), enabling deep forensic analysis.
In our next lesson, we will build directly on these analytical skills. You will learn to analyze and optimize image size using tools like docker history and Dive. We've touched on history today, but next time we'll use it alongside other tools to systematically shrink our images, leading to faster builds, smaller storage footprints, and improved security.