Welcome to our new lesson. In our last session, we focused on building resilient code by handling runtime errors with On Error statements. This is crucial for creating professional, user-friendly tools that don't crash. However, when an error does occur, or when your code produces an unexpected result, simply catching the error isn't enough. You need to find the root cause and fix it.
This lesson is about the art of "debugging" — the systematic process of hunting down and resolving bugs in your code. We will move beyond just managing errors to actively investigating them. You will learn how to pause your code mid-execution, step through it one line at a time, and inspect the values of your variables to see exactly what’s happening "under the hood." For a freelancer, delivering reliable, bug-free automations is paramount, and mastering these debugging skills is a non-negotiable step toward that goal.
1. The Debugging Mindset: Pausing and Stepping
The fundamental principle of debugging is to transition from simply running your code to observing it. VBA allows you to enter "Break Mode," a state where execution is paused, giving you time to analyze the situation. The most direct way to do this is by stepping through your code from the very beginning.
Place your cursor anywhere inside a Sub procedure and press the F8 key. This command, called Step Into, executes a single line of code and then pauses, highlighting the next line to be executed in yellow.
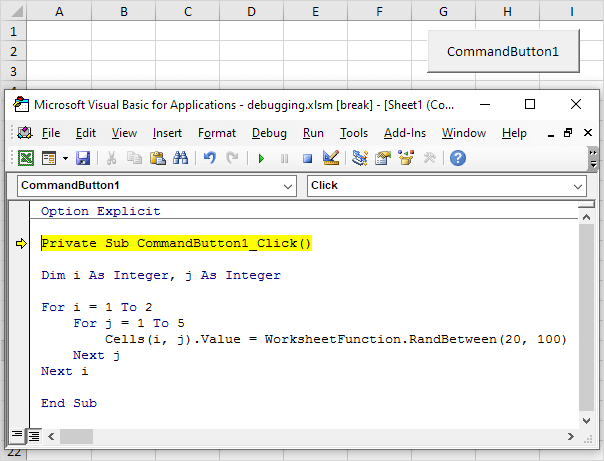
Each press of F8 moves you forward one executable line. Blank lines and variable declarations (lines starting with Dim) are skipped, as they don't perform an action at runtime. This process allows you to watch the logical flow of your program unfold step by step.
The video below introduces the core debugging tools and demonstrates this fundamental process of stepping through code.
Master VBA Debugging in 20 Minutes
The video "Master VBA Debugging in 20 Minutes" from Excel Macro Mastery provides an excellent introduction.
First, watch the overview from the beginning to the end of the introduction to understand the "what" and "why" of debugging. Then, continue with the segment from the demonstration of stepping to see the Step Into (F8) key in action. Notice how the presenter hovers the mouse over variables to quickly inspect their values as the code progresses.
While hovering is useful for checking one or two variables, it becomes cumbersome in more complex procedures. For a more comprehensive view, we need a dedicated tool.
2. The Locals Window: Your Code's Dashboard
The Locals Window is your primary dashboard during a debugging session. It automatically displays every variable that is currently in scope (i.e., accessible within the current procedure) and shows their real-time values and data types. As you press F8 to step through your code, you can watch the values in the Locals Window change, giving you immediate feedback on what your code is doing.
To open it, go to the View menu in the VBE and select Locals Window. It's best to have this window visible whenever you are debugging.
VBA Tutorial 4 - Debugging Tools
This article from Excel Macro Mastery provides a clear written explanation of the Locals Window.
Please read the section titled Locals Window. It explains how the window is automatically populated and how it displays different types of variables.
The next video demonstrates the Locals Window in a practical context, showing how it helps track variables inside a loop.
The video "Excel VBA - Debugging" from TutorialsPoint offers a concise look at using the Locals Window.
Watch the segment from the Locals Window demonstration. Observe how the values for the variables a, b, and i change with each iteration of the loop. This is a classic use case for the Locals Window.

3. Breakpoints: Setting Strategic Traps
Stepping through a procedure from the beginning with F8 is fine for short macros, but what if your bug is inside a loop that runs 10,000 times? Pressing F8 that many times is not an option. This is where breakpoints come in.
A breakpoint is a marker you place on a line of code that tells VBA: "Run normally, but pause before you execute this specific line."
To set a breakpoint, simply click in the grey margin to the left of the line of code, or click on the line and press F9. A brown circle will appear, and the line will be highlighted in brown. You can set multiple breakpoints. To remove one, just click the circle again.
Once a breakpoint is set, you can run your code normally (using the Run button or F5). Execution will proceed at full speed until it hits the breakpoint, at which point it will enter Break Mode. From there, you can begin your detailed investigation using F8 and the Locals Window.
VBA Tutorial 4 - Debugging Tools
Let's return to the Excel Macro Mastery article for a textual guide on breakpoints.
Read the section titled Using a Breakpoint. This will solidify your understanding of how to set, use, and remove breakpoints.
4. Advanced Navigation and Inspection
Once you're comfortable with the basics, you can use more advanced tools to navigate your code even more efficiently.
Step Over and Step Out
Sometimes your code calls another procedure.
- Step Into (F8): As we've seen, this will jump into the called procedure and allow you to debug it line by line.
- Step Over (Shift+F8): This executes the called procedure in its entirety without stepping through it, and pauses on the very next line in your current procedure. Use this when you are confident the other procedure works correctly and you don't need to inspect it.
- Step Out (Ctrl+Shift+F8): If you've stepped into a procedure by mistake, this command will execute the remaining lines of that procedure and pause back in the code that called it.
The Watch Window
The Watch Window is a more powerful alternative to the Locals Window. Instead of showing all variables, it only shows the specific variables or expressions you tell it to "watch." This is invaluable in complex projects where the Locals Window might be cluttered with dozens of variables.
To add a watch, right-click a variable in your code and select Add Watch.... You can also configure a watch to act as a conditional breakpoint, pausing the code only when an expression becomes true (e.g., i = 500) or when a variable's value changes.
The following video masterfully explains these navigation techniques and the power of the Watch Window.
Master VBA Debugging in 20 Minutes
Let's go back to the "Master VBA Debugging" video for a deeper dive.
First, watch the section explaining the differences between stepping methods. This will clarify when to use Step Into, Step Over, and Step Out. Next, watch the detailed segment on the Watch Window. Pay close attention to how you can watch not just variables, but also complex expressions and object properties like rng.Address and rng.Parent.Name. This is an extremely powerful technique for freelance work where you may inherit complex code.
5. Putting It All Together: A Debugging Workflow
You now have a complete toolkit for debugging. Here’s a systematic workflow to follow when you encounter a bug:
- Reproduce the Bug: Understand the conditions that cause the error or incorrect output.
- Form a Hypothesis: Make an educated guess about which part of your code is failing.
- Set a Breakpoint: Place a breakpoint just before the suspicious section of code.
- Run and Pause: Run the macro. It will pause at your breakpoint.
- Inspect: Use the Locals or Watch Window to examine the state of your variables. Are they what you expect them to be?
- Step Through: Use F8 (
Step Into) and Shift+F8 (Step Over) to execute the code line by line, watching the variables after each step. - Isolate the Fault: Pinpoint the exact line where a variable gets an incorrect value or an action fails.
- Fix and Retest: Stop the code, apply your fix, and run the macro again to confirm the bug is gone.
The final segment of the "Master VBA Debugging" video walks through exactly this process in a real-world scenario.
Master VBA Debugging in 20 Minutes
Watching a pro work is one of the best ways to learn. This part of the video is an excellent case study.
Watch the final example from finding and fixing an error. Notice how the presenter uses a combination of breakpoints, conditional watches, and stepping to systematically isolate and correct a logical error in the code.
Conclusion
You have now acquired a fundamental skill for any developer: the ability to systematically find and fix bugs. This process is not a sign of failure; it is an integral part of programming. By treating bugs as puzzles to be solved, you will build more robust, reliable, and professional tools for your clients.
Key Takeaways:
- Break Mode is a paused state that lets you inspect your code's execution.
- Stepping (
F8) executes your code one line at a time. - Breakpoints (
F9) are stop signs that pause your code at strategic points. - The Locals Window provides a dashboard showing the real-time values of all current variables.
- The Watch Window allows you to monitor specific variables or expressions and set conditional breakpoints.
- A systematic workflow (Hypothesize -> Breakpoint -> Inspect -> Step -> Isolate) is the key to efficient debugging.
In our next lesson, we'll shift gears and learn how to create your own custom functions (UDFs). This will allow you to package your logic into reusable formulas that you and your clients can use directly in Excel worksheets, just like built-in functions such as SUM or VLOOKUP.