Introduction
Welcome to the final lesson of our module on Data Visualization and Interactive Dashboards. Over the past few lessons, you have assembled an impressive toolkit: creating various charts, visualizing PivotTable data, and adding interactivity with Slicers, Timelines, and Form Controls. Now, it's time to bring all these skills together in a capstone project.
Our goal for this lesson is to design and build a complete, professional-grade interactive dashboard from scratch. This is a crucial skill for your freelance career, as creating insightful and easy-to-use dashboards is one of the most common client requests. We will construct a multi-report accounting dashboard, focusing on building out the first report—the Profit and Loss statement—and setting up a sophisticated navigation system that you can expand upon. This project will not only consolidate what you've learned but also give you a glimpse into the power of VBA, a topic we will dive into deeply in later modules.
1. Principles of Dashboard Design
Before we start building, let's consider what makes a dashboard effective. A great dashboard provides a clear, at-a-glance view of key performance indicators (KPIs), is easy to navigate, and allows the user to explore the data.
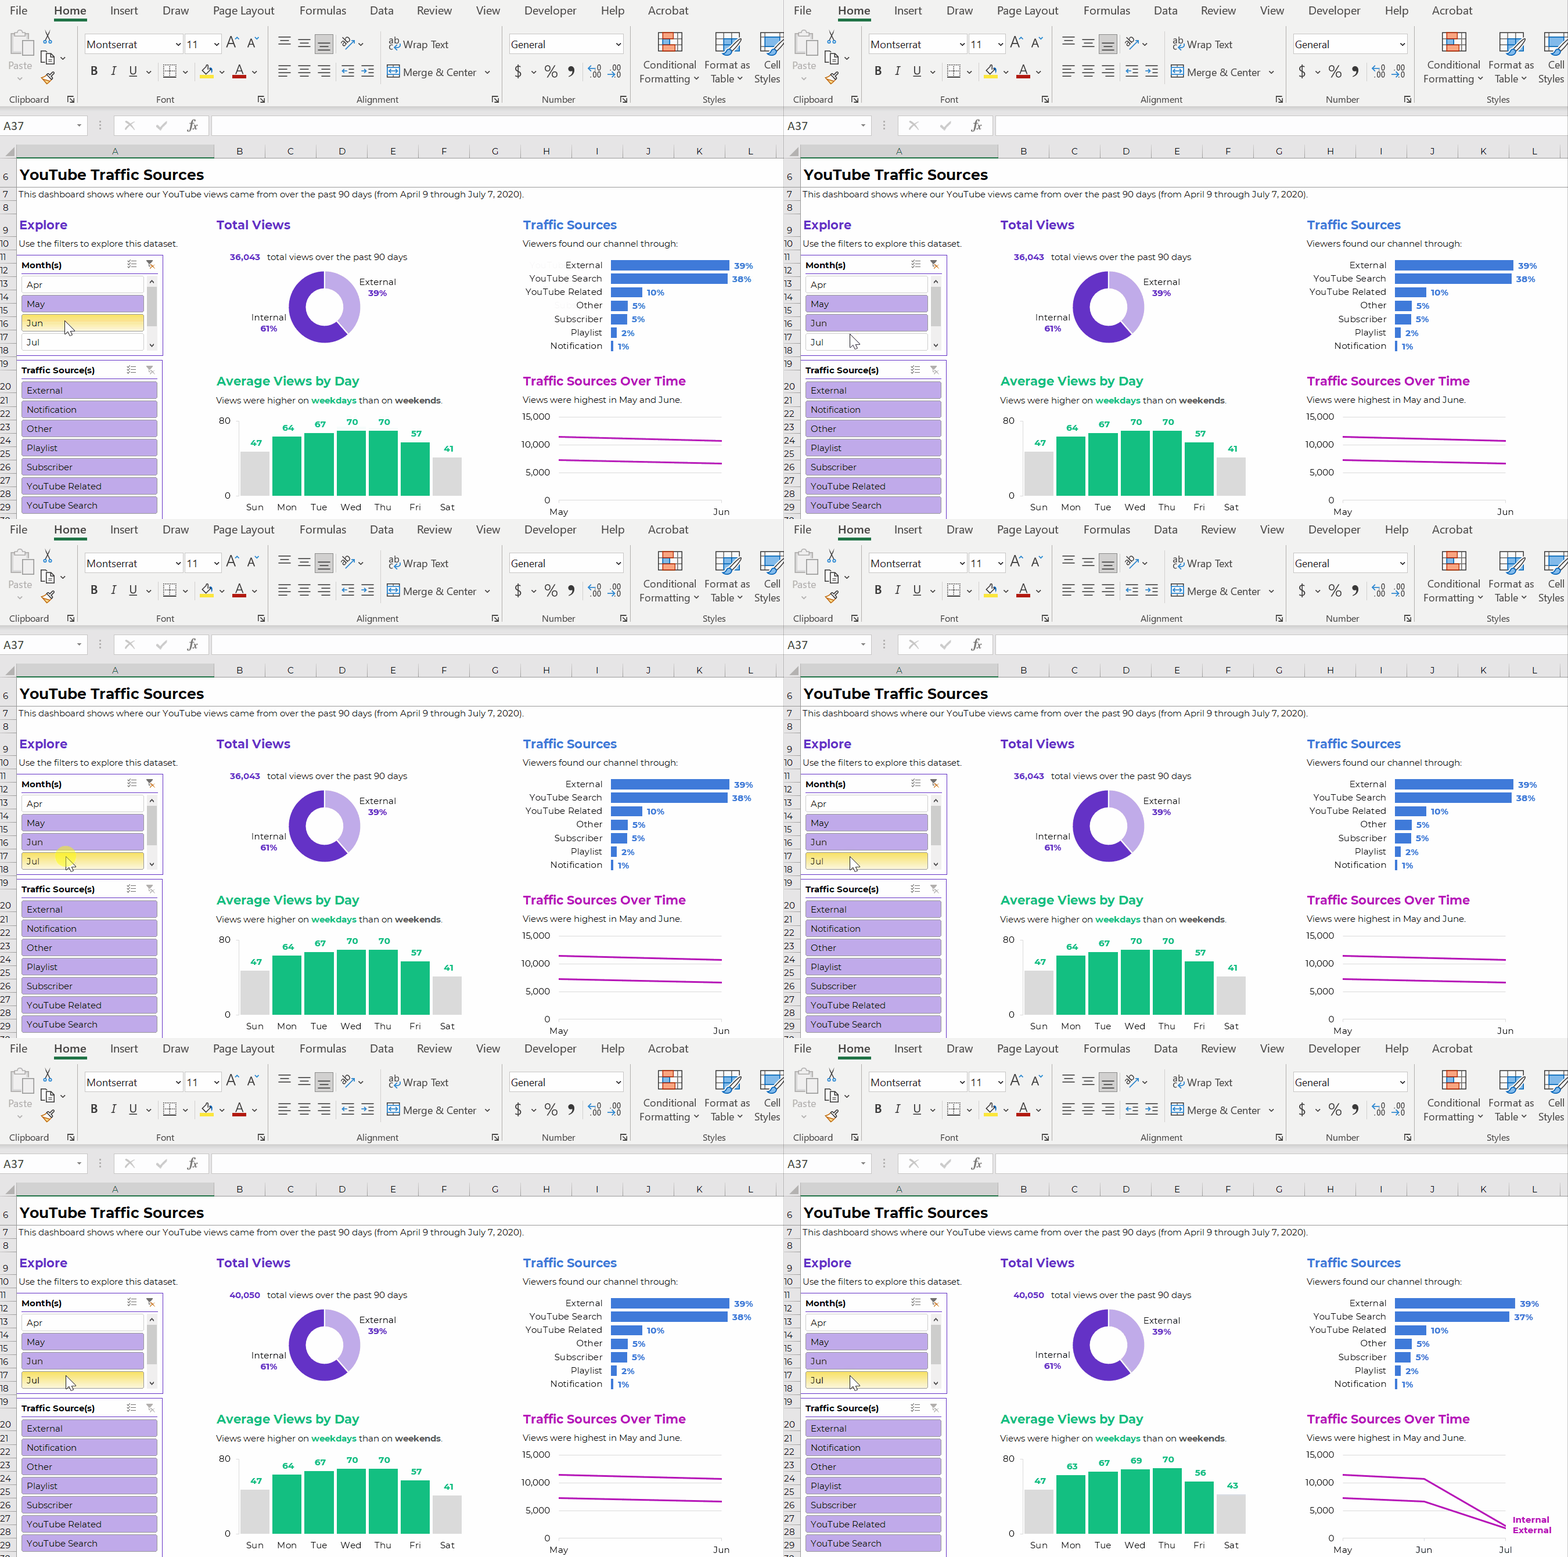
Our project will follow these principles. We will create a main "canvas" for our dashboard and build different reports (like Profit & Loss, Balance Sheet, etc.) that can be displayed on this canvas. We'll use simple shapes as navigation buttons to switch between these reports, creating a seamless user experience.
2. Setting Up the Dashboard Canvas and Navigation
The first step in any dashboard project is to establish the layout and structure. This involves designing the header, choosing a color theme, and creating the navigation elements. For our project, we'll use a dropdown list for year selection and shapes that will act as our navigation buttons.
The video below provides a detailed walkthrough of this setup process. As you watch, focus on the deliberate design choices being made to create a professional and organized foundation for the dashboard.
The Ultimate Excel Accounting Dashboard – Full Course
The video "The Ultimate Excel Accounting Dashboard" from the Excel For Freelancers channel will be our guide for this project. We'll start with the initial setup.
Please watch the section on creating the dashboard framework. Pay attention to these key steps, which you should replicate in your own workbook: Worksheet Formatting: Setting the background color and creating a colored header section to define the main areas of the dashboard. Year Selector: Creating a list of years on a helper sheet, defining it as a Named Range ("Years"), and then using Data Validation on the dashboard to create a dropdown list that references this named range. This is a technique you've seen before and is fundamental for user input. Navigation Buttons: Inserting basic shapes and formatting them to look like buttons. Notice how they are named (Report 1, Report 2, etc.) in the selection pane. This naming is crucial for the interactivity we will add later.
After completing these steps, you will have a visually appealing but static dashboard shell, ready for its first report.
3. Building the Profit & Loss Report with Dynamic Formulas
With our canvas ready, we can now build the first and most common financial report: the Profit and Loss (P&L) statement. Instead of hardcoding values, we will build it using dynamic formulas that respond to the year selected in our dropdown. This section is a fantastic real-world application of the advanced formula skills you developed in Modules 1 and 2.
The process involves creating named ranges for the start and end dates derived from the selected year, and then using SUMIFS to pull the correct values from a table of transactions.
The Ultimate Excel Accounting Dashboard – Full Course
We'll now continue with the same video to build out the P&L report.
Watch this segment from building the Profit and Loss statement. The key takeaways here are: Dynamic Date Ranges: See how the DATE function is used with the Selected_Year named range to create a StartDate and EndDate. This ensures the entire report updates when the user selects a new year. The Core SUMIFS Formula: The instructor builds a powerful SUMIFS formula to calculate the balance for each account. Pay close attention to the structure: it sums credits and subtracts debits, based on multiple criteria (account name, and a date range between the StartDate and EndDate). Formula Adaptation: Notice the subtle but critical difference in the formula for income accounts (credits - debits) versus expense accounts (debits - credits). This reflects fundamental accounting principles. Formatting for Clarity: Finally, observe the use of bolding, borders, and subtotals to structure the P&L statement for maximum readability.
At this point, you have a fully functional P&L report that dynamically updates based on the year selected. Now, let's visualize it.
4. Visualizing the Report Data
A table of numbers is informative, but charts make the data intuitive. We will add a set of charts to accompany our P&L report, choosing chart types that best represent each component of the data.
The Ultimate Excel Accounting Dashboard – Full Course
This next segment focuses on adding and styling charts to match our dashboard's theme.
Please watch the section on creating charts for the P&L report. As you follow along, take note of these professional techniques: Chart Selection: A column chart is used for income sources, a pie chart for the two components of Cost of Goods Sold (COGS), and a bar chart for the longer list of expenses. This variety keeps the dashboard engaging. Consistent Theming: The instructor applies a consistent color scheme, background gradient, and font styling to all charts, making the dashboard look cohesive and professional. Reducing Chart Junk: Elements like gridlines and unnecessary axes are removed to focus the viewer's attention on the data itself. Grouping Charts: All charts related to the P&L report are grouped together and given a specific name (pnl_grp). This is a critical step for the interactivity we're about to build.
Your dashboard now has a dynamic P&L report and a corresponding set of beautiful, consistently styled charts. The final step is to wire up the navigation.
5. A Preview of VBA: Creating Advanced Interactivity
So far, you've learned to create interactivity with Slicers and Form Controls. Now, we'll implement a more powerful technique using Visual Basic for Applications (VBA). This will allow us to use our navigation "buttons" to hide and show entire sections of the worksheet, including both the report tables and the chart groups.
While we have dedicated modules on VBA coming up, this practical example will give you a powerful demonstration of what's possible. We will write a small set of macros to control the visibility of our reports.
The logic is simple but effective:
- Create a master macro that hides all reports and all chart groups.
- For each button, create a specific macro that first calls the master "hide everything" macro.
- This specific macro then un-hides only the rows and the chart group relevant to that button.
The Ultimate Excel Accounting Dashboard – Full Course
This final segment demonstrates how to tie everything together with VBA to create a seamless user experience. Don't worry about understanding every line of code; focus on the overall logic and the outcome.
Carefully follow the steps in this section on making the dashboard interactive. Here are the key concepts being demonstrated: Grouping Objects: All charts for a given report are grouped, and the group is given a descriptive name (e.g., pnl_grp, Balance_Sheet_Group). The "Hide All" Macro: A subroutine (Hide_All_Reports) is created to set the .Visible property of all chart groups to False and the .Hidden property of all report rows to True. Report-Specific Macros: A macro is created for each button (e.g., Report_pnl). It first calls Hide_All_Reports, then makes the specific rows and chart group visible again. Highlighting the Active Button: The macro uses a clever trick (Application.Caller) to identify which shape was clicked, and then changes its color to give the user visual feedback on their selection. Assigning Macros: Finally, each macro is assigned to its corresponding button shape by right-clicking the shape and choosing "Assign Macro."
By following these steps, you have transformed your collection of tables and charts into a single, cohesive, and interactive application.
Conclusion
Congratulations! You have successfully designed and built a sophisticated, client-ready dashboard. This project has integrated skills from across our entire course so far—from foundational formulas and data structures to advanced visualization and interactivity.
Key Takeaways from this project:
- Dashboard construction is a process: It moves from layout and design, to data modeling with formulas, to visualization with charts, and finally to implementing interactivity.
- Named Ranges are essential: They make formulas (
SUMIFS,Data Validation) more readable and robust. - Consistent formatting is key: A unified color scheme and layout elevate a functional report into a professional product.
- There are multiple ways to create interactivity: You now know how to use Slicers, Form Controls, and VBA-powered buttons, giving you a range of options to suit different needs.
- VBA unlocks a new level of control: You've had a taste of how VBA can automate actions and create custom user experiences that are impossible with formulas alone.
You have now completed the Data Visualization module. The P&L statement you built today is a perfect transition to our next module, Financial Modeling Fundamentals, where we will explore how to build comprehensive financial forecasts and analyses.