Welcome to your final lesson and capstone project. Throughout this course, you've moved from the fundamentals of Excel to mastering its most powerful features for data analysis, modeling, and automation. Now, it's time to bring all those skills together.
In our previous lesson, we focused on the crucial final steps of professionalizing a deliverable: cleaning metadata and setting a polished default view. That was the final polish. Today, you will build the entire product that would precede such a polish.
This lesson is designed to mirror a real-world freelance assignment. You will build a complete, client-ready sales dashboard from scratch. This project will require you to integrate everything you've learned:
- Power Query for data extraction and transformation.
- Power Pivot to build a relational data model.
- PivotTables and PivotCharts for analysis and visualization.
- VBA to automate key dashboard functions.
By the end of this lesson, you will have built a sophisticated, interactive dashboard, demonstrating your ability to deliver a comprehensive solution that meets a client's business intelligence needs.
The Capstone Project: A Dynamic Sales Dashboard
Imagine a client, a retail company, has approached you. They have sales data spread across multiple files and formats, and they need a way to visualize their performance. Your task is to build an interactive dashboard that consolidates their data and allows them to explore sales by month, product category, and country.
This is what the final product will look something like:
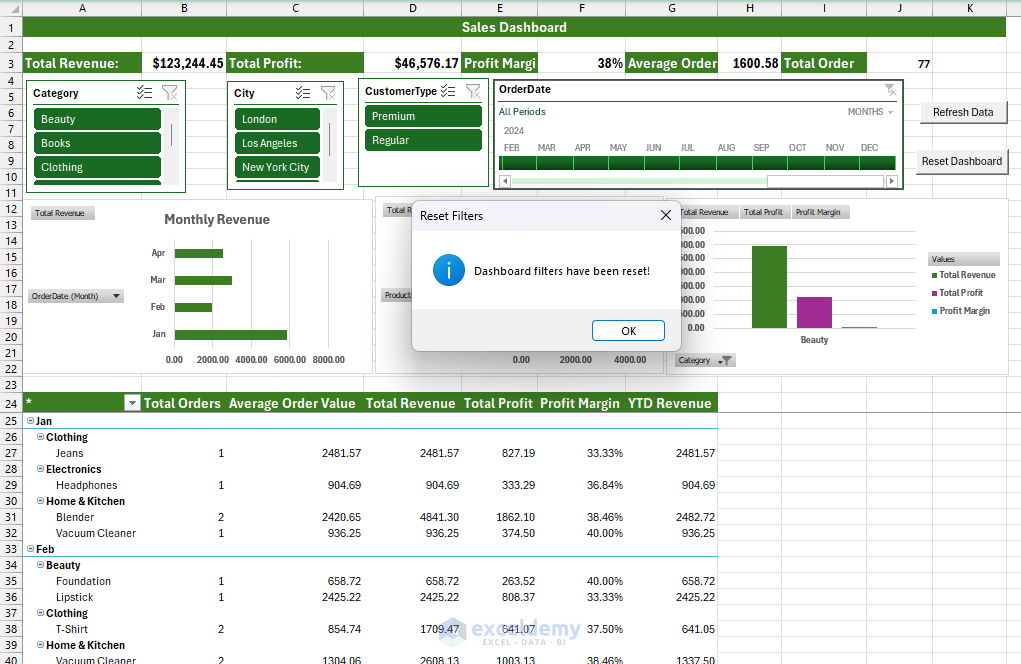
Let's begin.
Part 1: From Raw Data to a Cohesive Data Model
The first and most critical phase of any data project is preparing the data. Your client's data is currently siloed: sales transactions are in a database export, product details are in a CSV file, and store information is in a PDF. Manually combining this would be a nightmare. This is a perfect use case for Power Query and Power Pivot.
The following video provides a masterful walkthrough of this entire process, from connecting to disparate data sources to building an interactive dashboard. We will use it as our primary guide for the core build.
Use Excel Like a PRO | Learn Power Query, Power Pivot & DAX in 15 MINUTES (project files included!)
The video "Use Excel Like a PRO" from Maven Analytics is a condensed, project-based tutorial that perfectly demonstrates the modern Excel BI workflow. We will work through it step-by-step.
First, we'll handle the data preparation and modeling. Please watch the following segments carefully and replicate the steps in a blank Excel workbook. Data Ingestion & Transformation: Watch from this segment to see how to use Power Query to connect to multiple sources (SQL, CSV, PDF), apply basic transformations, and create a calendar table. Pay close attention to how each query is loaded as a "connection only" and added to the Data Model. This is the foundation of our project. Data Modeling: Next, watch from this section. Here, you'll learn how to open the Power Pivot window and use the Diagram View to create relationships between your tables. This step is what allows you to analyze data from all four tables simultaneously.
At this point, you have successfully built a robust data model. You've used Power Query to create an automated and repeatable ETL (Extract, Transform, Load) process and Power Pivot to define the relationships between your datasets. This model is now ready for analysis.
Part 2: Analysis and Visualization
With the data model in place, we can now start creating the components of our dashboard. This involves creating summary calculations using DAX (Data Analysis Expressions) and then visualizing them with PivotTables and PivotCharts.
Let's continue with the Maven Analytics video.
Use Excel Like a PRO | Learn Power Query, Power Pivot & DAX in 15 MINUTES (project files included!)
Now we will build the analytical layer on top of our data model.
Please watch and follow along with these remaining parts of the video: Creating the PivotTable: Watch from this segment to learn how to insert a PivotTable from the Data Model. Notice how the PivotTable Fields list now contains all four of your tables, ready to be used together. Enhancing with DAX Measures: The raw data has quantity, but not revenue. Watch from this section to see how to create new calculations called "measures" using DAX. You will create Total Orders and Total Revenue. This is a core concept in data modeling, allowing you to define your key business metrics centrally. Building the Dashboard: Finally, watch from this part to assemble the dashboard. You will create a line chart for monthly revenue, a bar chart for orders by category, and add a slicer to filter both charts by country, making the report interactive.
You now have a fully functional, interactive dashboard. This in itself is a valuable deliverable. However, to elevate it to a truly professional, client-ready tool, we can add a layer of automation.
Part 3: Enhancing Interactivity with VBA
A great dashboard should be effortless for the end-user. Instead of asking them to navigate menus to refresh data or reset filters, you can provide simple buttons to perform these actions. This is where your VBA skills come into play.
We will add two buttons to our dashboard:
- Refresh Data: A button that runs all the Power Query connections and updates the PivotTables with the latest data.
- Reset Dashboard: A button that clears all active filters on the slicers, returning the dashboard to its default view.
The following article provides a clear guide on how to implement these features.
Building Advanced Excel Dashboards: Power Query, ...
This article from ExcelDemy walks through a similar dashboard-building process and includes a section on adding VBA for automation.
Please read the section Step 5: Automate and Enhance Interactivity with VBA. Follow the instructions to: Insert a shape to act as your "Refresh Data" button. Create a new VBA macro with the code ThisWorkbook.RefreshAll and assign it to your button. Do the same for a "Reset Dashboard" button. The code to clear slicers will be slightly different from the article's, as slicer names vary. A typical line of code would be ThisWorkbook.SlicerCaches("Slicer_Country").ClearManualFilter. You would need one such line for each slicer in your dashboard.
These simple macros significantly improve the user experience, making your tool more intuitive and professional.
Part 4: The Final Delivery
Congratulations! You have successfully built a complete, client-ready solution that integrates the full stack of modern Excel tools.
As the final step before sending this to your "client," you would now apply the pre-delivery checklist from our previous lesson:
- Save a copy of the workbook.
- Use the Document Inspector to remove any hidden data or personal information.
- Set the workbook to open on the Dashboard sheet, with cell A1 selected and a clean view (gridlines, headings, and formula bar hidden).
- Perform a final save.
Conclusion
This capstone project marks the culmination of your journey from an Excel novice to a capable data professional. You've demonstrated the ability to tackle a complex business problem from end to end, turning messy, disparate data into a powerful, interactive, and automated business intelligence tool.
Key Takeaways from Your Journey:
- You've mastered the art of data transformation with Power Query, building automated pipelines that save countless hours.
- You can structure complex datasets into a relational Data Model using Power Pivot.
- You can derive insights and visualize performance using PivotTables, DAX measures, and PivotCharts.
- You can enhance user experience and automate repetitive tasks with VBA macros.
- You understand how to package your work into a professional, secure, and client-ready deliverable.
You now possess the comprehensive skill set required to operate as an expert Excel freelancer. The path forward involves continuing to practice, taking on new challenges, and building a portfolio of projects like this one to showcase your abilities to potential clients. Well done, and best of luck in your career.