Welcome back! In our previous lesson, you built a fully functional UserForm to capture, validate, and store client data in a worksheet. This is a crucial skill for ensuring high-quality data input. Now that you have a method for collecting clean, raw data, the next logical step is to transform it into a polished, insightful report for a client.
This lesson addresses exactly that. You will learn how to write a VBA procedure to automate the entire process of report creation and formatting. We'll take a sheet of raw data and, with a single click, convert it into a professional-looking summary complete with calculations, formatting, and a chart. This is one of the most powerful and frequently requested automation tasks in the freelance world, saving hours of manual work and ensuring consistent, error-free outputs.
The Goal: From Raw Data to Polished Report
The core idea is to transform something messy and hard to read into something clear and professional.

To achieve this, we won't write one single, monolithic block of code. Instead, we'll adopt a "divide and conquer" strategy, breaking the problem into three logical parts:
- Calculate & Summarize: Create a summary section with key totals and metrics derived from the raw data.
- Format: Apply professional formatting like colors, fonts, borders, and number styles to make the report readable.
- Visualize: Generate a chart to provide a quick, visual understanding of the data.
Finally, we'll create a Main procedure that runs these three parts in sequence, all triggered by a single button.
Setting Up the Scenario
Imagine your Clients worksheet from the last lesson now also tracks the financial details for each project. Create a new worksheet named RawData and populate it with the following sample data. This will be the starting point for our automation.
| Project Type | Client | Revenue | Cost |
|---|---|---|---|
| Website Design | Alpha Corp | 15000 | 8000 |
| VBA Automation | Beta Inc | 8500 | 2500 |
| Dashboard Build | Gamma LLC | 12000 | 5500 |
| Website Design | Delta Co | 18000 | 9500 |
| VBA Automation | Epsilon Group | 9200 | 3100 |
| Dashboard Build | Zeta Systems | 13500 | 6200 |
| Website Design | Eta Solutions | 14500 | 7800 |
Our goal is to create a new, formatted report on a separate sheet that summarizes the total revenue, cost, and profit for each project type, and includes a chart.
Step 1: Calculate and Summarize the Data
Before we worry about fonts and colors, we need to process the numbers. A good report always includes summary statistics. We will write a procedure that creates a summary table and uses formulas within VBA to calculate the totals.
The following video is a masterclass in VBA formatting and calculations. We'll start by focusing on a section that demonstrates how to dynamically add totals to a report.
The Only VBA Formatting Masterclass You’ll Ever Need
The video "The Only VBA Formatting Masterclass You’ll Ever Need" by Excel For Freelancers shows how to build a fully formatted report from scratch. This particular section is perfect for learning how to add dynamic calculations.
Watch the segment on adding dynamic totals (dynamic totals). Pay close attention to how the code: Adds labels for the summary section (e.g., "Total Income," "Total Expenses"). Uses the SUMIF formula within VBA to calculate totals based on criteria. Makes the formula dynamic by incorporating the lastRow variable, so it works even if the amount of raw data changes.
Now, let's apply this logic. Open the VBA Editor (Alt + F11), insert a new module, and add the following code. This procedure will create a new sheet called "Report", set up headers for a summary table, and then populate it by pulling unique project types from our RawData sheet.
Sub CreateSummary()

    ' Declare variables
    Dim wsData As Worksheet, wsReport As Worksheet
    Dim dataRange As Range, cell As Range
    Dim reportRow As Long

    ' Set worksheet objects
    Set wsData = ThisWorkbook.Worksheets("RawData")
    Set wsReport = ThisWorkbook.Worksheets.Add(After:=wsData)
    wsReport.Name = "Summary Report"

    ' --- Create Summary Table Headers ---
    With wsReport.Range("B2:F2")
        .Value = Array("Project Type", "Total Revenue", "Total Cost", "Profit", "Profit Margin")
        .Font.Bold = True
    End With

    ' --- Get Unique Project Types ---
    ' Using a Dictionary to get unique values is a robust method
    Dim uniqueProjects As Object
    Set uniqueProjects = CreateObject("Scripting.Dictionary")

    ' Find last row in RawData
    Dim lastRowData As Long
    lastRowData = wsData.Cells(wsData.Rows.Count, "A").End(xlUp).Row

    Set dataRange = wsData.Range("A2:A" & lastRowData)

    ' Loop through data to find unique project types
    For Each cell In dataRange
        If Not uniqueProjects.Exists(cell.Value) Then
            uniqueProjects.Add cell.Value, 1
        End If
    Next cell

    ' --- Populate Summary Table with Formulas ---
    reportRow = 3
    Dim projType As Variant

    For Each projType In uniqueProjects.Keys
        ' Add project type name
        wsReport.Cells(reportRow, 2).Value = projType

        ' Formula for Total Revenue (SUMIF)
        wsReport.Cells(reportRow, 3).Formula = "=SUMIF(RawData!A:A, B" & reportRow & ", RawData!C:C)"

        ' Formula for Total Cost (SUMIF)
        wsReport.Cells(reportRow, 4).Formula = "=SUMIF(RawData!A:A, B" & reportRow & ", RawData!D:D)"

        ' Formula for Profit
        wsReport.Cells(reportRow, 5).Formula = "=C" & reportRow & "-D" & reportRow

        ' Formula for Profit Margin
        wsReport.Cells(reportRow, 6).Formula = "=E" & reportRow & "/C" & reportRow

        reportRow = reportRow + 1
    Next projType

End Sub
Run this CreateSummary macro. It will generate a new "Summary Report" sheet with the calculated data. It's functional, but it's not pretty. That's what we'll fix next.
Step 2: Apply Professional Formatting
Now we'll create a second procedure dedicated to formatting our new report. We'll add a title, apply number formatting, adjust column widths, and add borders.
This article provides excellent, clear code examples for common formatting tasks.
How to Automate Excel Reports with VBA: Step-by- ...
This guide from vbacode.io gives a structured approach to report automation. The formatting section is particularly useful.
Read through Step 4: Professional Formatting. Note the use of a With block to apply multiple formats to a range efficiently, and the simple, direct lines for applying number formats and autofitting columns.
Let's write our ApplyFormatting procedure. Add this code to your module:
Sub ApplyFormatting()

    Dim wsReport As Worksheet
    Dim lastRow As Long

    Set wsReport = ThisWorkbook.Worksheets("Summary Report")
    lastRow = wsReport.Cells(wsReport.Rows.Count, "B").End(xlUp).Row

    ' --- Add Title ---
    With wsReport.Range("B1")
        .Value = "Project Financial Summary"
        .Font.Bold = True
        .Font.Size = 16
    End With

    ' --- Format Data Table ---
    ' Apply number formats
    wsReport.Range("C3:E" & lastRow).NumberFormat = "$#,##0" ' Currency
    wsReport.Range("F3:F" & lastRow).NumberFormat = "0.0%"  ' Percentage

    ' Format Header
    With wsReport.Range("B2:F2")
        .Interior.Color = RGB(68, 84, 106) ' Dark Blue
        .Font.Color = RGB(255, 255, 255)   ' White
    End With

    ' Add borders
    wsReport.Range("B2:F" & lastRow).Borders.LineStyle = xlContinuous
    wsReport.Range("B2:F" & lastRow).Borders.Weight = xlThin

    ' Auto-fit columns
    wsReport.Columns("B:F").AutoFit

End Sub
If you have already run CreateSummary, delete the "Summary Report" sheet first, then run CreateSummary and ApplyFormatting one after the other. Your report should now look much more professional.
Step 3: Add a Chart
The final piece is a visualization. A chart can make the relationships in the data instantly obvious to your client. We'll write a procedure to create a clustered column chart comparing revenue and cost for each project type.
The same article from vbacode.io provides a perfect template for creating a dynamic chart.
How to Automate Excel Reports with VBA: Step-by- ...
We'll use the same guide as before, this time focusing on its charting section.
Study the code in Step 3: Dynamic Chart Creation. The key elements are: Defining the chartRange dynamically using the last row. Using Shapes.AddChart2 to create the chart object. Using a With block to set the chart's source data, title, and other properties.
Here is the procedure to add our chart. Add it to your module.
Sub CreateChart()

    Dim wsReport As Worksheet
    Dim chartRange As Range
    Dim salesChart As Chart
    Dim lastRow As Long

    Set wsReport = ThisWorkbook.Worksheets("Summary Report")
    lastRow = wsReport.Cells(wsReport.Rows.Count, "B").End(xlUp).Row

    ' Define the data range for the chart (Project Type, Revenue, Cost)
    Set chartRange = wsReport.Range("B2:D" & lastRow)

    ' Create the chart
    Set salesChart = wsReport.Shapes.AddChart2(240, xlColumnClustered, _
        wsReport.Range("H2").Left, wsReport.Range("H2").Top, 450, 300).Chart

    ' Format the chart
    With salesChart
        .SetSourceData Source:=chartRange
        .HasTitle = True
        .ChartTitle.Text = "Revenue vs. Cost by Project Type"
        .ChartTitle.Font.Bold = True
        .SetElement (msoElementLegendBottom) ' Move legend to the bottom
    End With

End Sub
Step 4: The Master Procedure
We now have three independent procedures. The final step is to create one "master" procedure that calls them in the correct order. This is what allows for one-click automation. We'll also add a bit of cleanup logic to delete the old report sheet if it exists, preventing errors.
Sub GenerateFullReport()

    ' Turn off screen updating to make the macro run faster and smoother
    Application.ScreenUpdating = False

    ' --- Error Handling: Delete old report sheet if it exists ---
    Application.DisplayAlerts = False ' Prevent confirmation popups
    On Error Resume Next ' If the sheet doesn't exist, just continue
    ThisWorkbook.Worksheets("Summary Report").Delete
    On Error GoTo 0 ' Reset error handling
    Application.DisplayAlerts = True

    ' --- Run the procedures in order ---
    Call CreateSummary
    Call ApplyFormatting
    Call CreateChart

    ' Activate the report sheet so the user sees it
    ThisWorkbook.Worksheets("Summary Report").Activate

    ' Turn screen updating back on
    Application.ScreenUpdating = True

    MsgBox "Report generation complete!", vbInformation

End Sub
Now, go to your RawData sheet. Insert a shape (Insert > Shapes > Rectangle), right-click it, select "Edit Text", and type "Generate Report". Then, right-click the shape again, choose "Assign Macro...", and select GenerateFullReport.
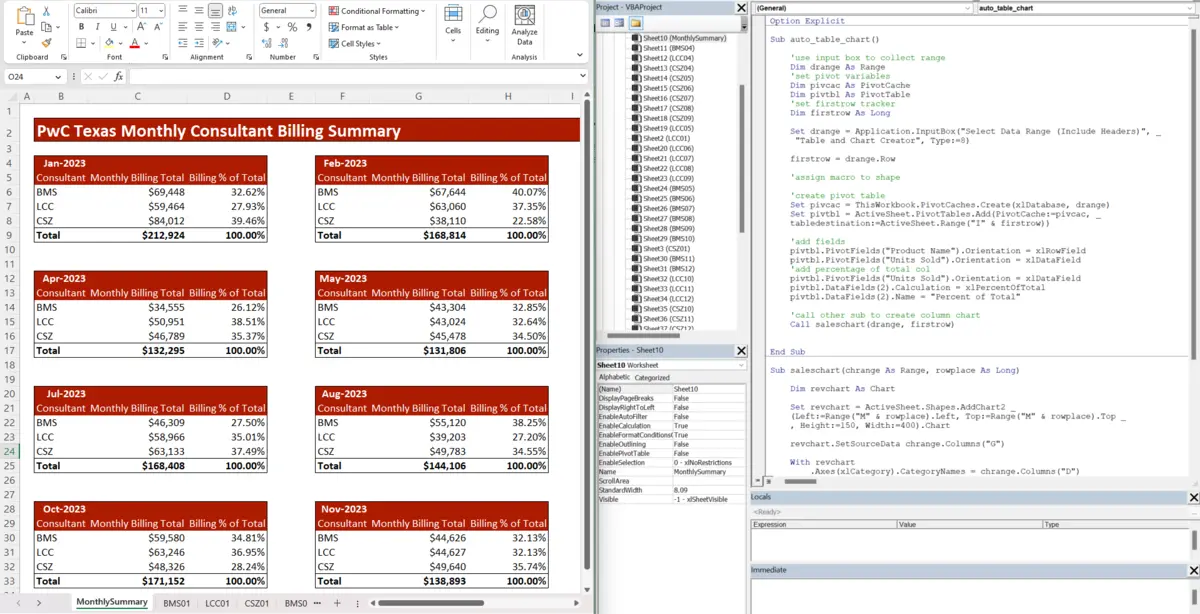
Click the button. In a flash, your fully automated, professionally formatted report is created.
Conclusion
In this lesson, you have built a powerful and practical automation script. You've learned how to structure a complex task by breaking it into smaller procedures, and how to combine them into a single, user-friendly process. This workflow—processing data, applying formatting, creating visualizations, and tying it all to a button—is a template you will use again and again in freelance projects.
Key Takeaways:
- Modular Design: Break down large automation tasks into smaller, logical
Subprocedures (e.g.,CreateSummary,ApplyFormatting,CreateChart). - Dynamic Formulas in VBA: You can write code that inserts worksheet formulas like
SUMIF, making your reports automatically calculated. - Object-Based Formatting: Manipulate chart and range properties (
.Font,.Interior,.Borders) to control the appearance of your report. - The Master Procedure: A single
Subthat calls other procedures in sequence is the key to creating a one-click solution. - User-Friendliness: Using
Application.ScreenUpdating = Falsemakes your macro run faster, while assigning it to a button makes it accessible to any user.
You now possess the core skills to turn raw data into a client-ready asset. In our next lesson, we will take a step back in the workflow and learn how to automate the process of importing data from an external text file, feeding the very 'raw data' that a procedure like this one would process.