Hello! Welcome to the first lesson in our "Practical Bash Automation Projects" module.
In the last module, we built a strong foundation in Bash scripting. We covered everything from variables and loops to advanced text processing with sed and awk. Most importantly, in our final lesson, we focused on how to write professional-quality scripts by following style guides and best practices.
Now, it's time to put all that theory into practice. Over the next few lessons, we will build, refine, and automate a series of real-world DevOps tasks, starting with one of the most fundamental: system monitoring.
Today's Learning Outcome: By the end of this lesson, you will be able to write a Bash script to capture and display current CPU, memory, and disk usage.
This is a classic and essential script for any DevOps engineer. It forms the basis for health checks, performance troubleshooting, and automated alerting. We will build it step-by-step, using the commands and best practices you've already learned.
1. Breaking Down the Problem
A good script starts with a clear plan. We need to capture three separate metrics:
- Memory Usage: How much RAM is being used?
- Disk Usage: How much space is used on our main storage volume?
- CPU Usage: What percentage of the CPU is currently active?
For each metric, we'll first identify a Linux command that provides the raw data. Then, we'll use our text-processing skills to parse the output and extract the exact value we need.
2. Capturing System Metrics
Let's tackle each metric one by one.
A. Memory Usage
The standard command for checking memory is free. Using the -m flag shows the values in megabytes, which is often easier to read.
$ free -m
              total        used        free      shared  buff/cache   available
Mem:           1986         525         178           1        1282        1297
Swap:             0           0           0
From this output, we are interested in the first line (Mem:). We want to calculate the percentage of used memory from the total and used columns. awk is the perfect tool for this.
free -m | awk 'NR==2 {printf "%.2f%%", $3*100/$2}'
Let's break down that awk command:
NR==2: This tellsawkto only process the second line of the input (theMem:line).{printf "%.2f%%", $3*100/$2}: This is the action.$3is the third field (theusedvalue).$2is the second field (thetotalvalue).- We calculate
($3 * 100 / $2)to get the percentage. printf "%.2f%%", ...formats the result as a floating-point number with two decimal places, followed by a literal%sign.
B. Disk Usage
To check disk space, we use the df (disk free) command. The -h flag makes the output "human-readable" (e.g., using G for gigabytes).
$ df -h
Filesystem      Size  Used Avail Use% Mounted on
/dev/root        59G   12G   48G  19% /
...
We typically care most about the root filesystem, which is mounted on /. We need to find that line and extract the value from the Use% column. Again, awk is excellent for this.
df -h | awk '$NF=="/" {printf "%s", $5}'
Let's break this down:
$NF=="/": This is a cleverawkpattern.$NFrefers to the last field on a line. So, this finds the line where the last field is exactly/(the mount point).{printf "%s", $5}: On that line, this prints the fifth field, which is theUse%value.
C. CPU Usage
Getting CPU usage is a bit more complex. The top command provides a wealth of real-time data. To use it in a script, we run it in "batch mode" (-b) for just one iteration (-n1).
$ top -bn1
...
%Cpu(s):  1.2 us,  0.5 sy,  0.0 ni, 98.3 id,  0.0 wa,  0.0 hi,  0.0 si,  0.0 st
...
The line starting with %Cpu(s) gives us a breakdown of what the CPU is doing. A common way to calculate total usage is to find the idle percentage (id) and subtract it from 100.
This requires a more advanced pipeline of commands.
Building a Simple System Monitoring Tool with Bash
The following article, 'Building a Simple System Monitoring Tool with Bash', explains a robust method for getting CPU, memory, and disk usage. We will follow its structured approach. Let's start by looking at its breakdown for each metric.
Please read the sections titled '1. Getting CPU Usage', '2. Getting Memory Usage', and '3. Getting Disk Usage'. Notice how each piece of logic is encapsulated in a function, which is a best practice we discussed.
As you saw in the article, the pipeline for CPU usage is:
top -bn1 | grep "Cpu(s)" | sed "s/.*, *\([0-9.]*\)%* id.*/\1/" | awk '{print 100 - $1"%"}'
This looks intimidating, so let's walk through it:
top -bn1 | grep "Cpu(s)": This isolates the CPU usage line.sed "s/.*, *$[0-9.]*$%* id.*/\1/": Thissedcommand uses a regular expression to extract the idle percentage. It essentially says "find the number that comes just before% idand print only that number."awk '{print 100 - $1"%"}': This takes the idle percentage fromsed(which becomes the first field,$1) and subtracts it from 100 to get the final usage percentage.
3. Assembling the Script
Now that we have the commands for each metric, let's put them together into a professional, reusable script. Following the best practices from our last lesson, we will:
- Use a
#!/usr/bin/env bashshebang. - Organize the logic for each metric into its own function.
- Use a
whileloop to run the script continuously. - Add
clearandsleepto create a refreshing "dashboard" effect.
Here is the structure we'll build:
#!/usr/bin/env bash

# Function to get memory usage
get_memory_usage() {
  # Command from section 2A goes here
}

# Function to get disk usage
get_disk_usage() {
  # Command from section 2B goes here
}

# Function to get CPU usage
get_cpu_usage() {
  # Command from section 2C goes here
}

# Main loop
while true; do
  clear
  echo "--- System Resource Monitor ---"
  get_memory_usage
  get_disk_usage
  get_cpu_usage
  sleep 5 # Refresh every 5 seconds
done
This structure is modular and easy to read. Each function has a single responsibility, which makes the script much easier to maintain and debug.
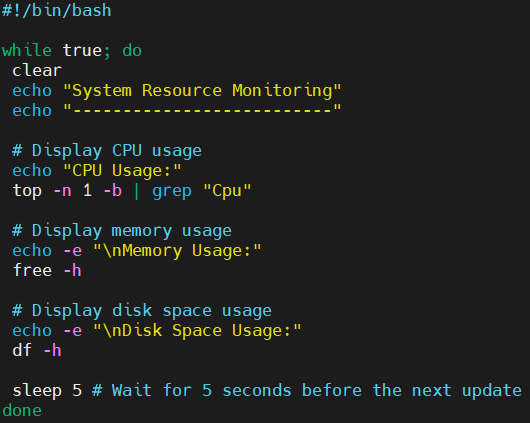
The following image shows an example of a similar script in action. Our goal is to create something that produces a clean, continuous output like this.
Test your understanding!
Now it's your turn to build the script. Create a new file called system_monitor.sh. Using the structure above and the commands we developed in section 2, complete the script.
Make sure your final script:
- Is executable (
chmod +x system_monitor.sh). - Has the correct shebang.
- Defines and uses the three functions (
get_memory_usage,get_disk_usage,get_cpu_usage). - Includes the main
whileloop withclearandsleep. - Prints the output in a clean, user-friendly format (e.g., with labels like "CPU Usage:").
Show answer
Here is the complete, working script.
#!/usr/bin/env bash

#
# A simple system monitoring script that displays CPU, memory, and disk usage.
#

get_cpu_usage() {
  # Extract the idle percentage from top, then subtract from 100
  CPU_USAGE=$(top -bn1 | grep "Cpu(s)" | \
              sed "s/.*, *\([0-9.]*\)%* id.*/\1/" | \
              awk '{print 100 - $1}')
  printf "CPU Usage: %.2f%%\n" "$CPU_USAGE"
}

get_memory_usage() {
  # Calculate memory usage percentage from the output of 'free -m'
  free -m | awk 'NR==2{printf "Memory Usage: %.2f%%\n", $3*100/$2 }'
}

get_disk_usage() {
  # Get the disk usage percentage for the root filesystem '/'
  df -h | awk '$NF=="/"{printf "Disk Usage: %s\n", $5}'
}

# Main loop to display the stats continuously
while true; do
  # Clear the screen for a clean display
  clear

  echo "--- System Resource Monitor ---"
  echo "Last updated: $(date)"
  echo ""

  # Call functions to display metrics
  get_cpu_usage
  get_memory_usage
  get_disk_usage

  # Wait for 5 seconds before the next update
  sleep 5
done
How it meets the requirements:
- It has a
#!/usr/bin/env bashshebang and a descriptive header comment. - The logic for each metric is neatly organized into its own function.
- The main
while trueloop calls these functions. clearandsleep 5create the continuous, refreshing monitor effect.printfandechoare used to format the output with clear labels for readability.
Conclusion
Congratulations! You've successfully built your first practical automation script in this module. You took a common DevOps requirement, broke it down into manageable parts, and used the tools at your disposal (top, free, df, awk, sed) to create a functional and well-structured monitoring tool.
Key Takeaways:
- Core Monitoring Commands: You learned to use
freefor memory,dffor disk, andtopfor CPU to get raw system data. - Practical Text Processing: You saw how powerful
awk,grep, andsedare for extracting specific information from command output. - Structured Scripting: You applied best practices by organizing your code into functions, making it modular, readable, and maintainable.
- Continuous Execution: You used a
whileloop withsleepto turn a one-off command into a continuous monitoring service.
Next Up
Our script is useful, but it could be smarter. Right now, it only displays information. A true monitoring tool should be able to react to it. In the next lesson, you will modify this script to include threshold checks and print a warning message if usage is high, taking the first step towards automated alerting.