Hello! Welcome back.
In our last lesson, we learned how to use ping and traceroute to diagnose connectivity to a remote machine and map the network path leading to it. These tools help answer the question, "Can I get there from here?".
Today, we're shifting our focus from the path to the server to what's happening on the server itself. As a DevOps engineer, once you've confirmed a server is reachable, the next question is often, "Is my application actually running and listening for connections?". This lesson will give you the primary tool to answer that. Our learning outcome is to inspect active network connections and listening ports using ss.
The ss command is a fundamental utility for network diagnostics on any modern Linux system, allowing you to see which services are listening, who is connected to them, and what state those connections are in.
From netstat to ss
For many years, the standard tool for this job was netstat. However, it has been superseded by ss (which stands for socket statistics). The ss command is part of the iproute2 package (which also includes the ip command you may have seen) and is considered superior to netstat because it's significantly faster and provides more detailed information.
Let's begin by exploring the capabilities of ss with a comprehensive guide.
The article 'How To Use Linux SS Command' from phoenixnap provides an excellent overview of the ss command. We'll use it as our primary reference.
Please read the introduction to understand the purpose of ss. Then, skip to the end and read the section 'netstat VS ss Command' to understand why ss is the modern standard.
Understanding Sockets
Before we dive into the commands, let's clarify what a "socket" is. In networking, a socket is an endpoint for communication between two machines. For our purposes, you can think of a socket as the combination of an IP address and a port number (e.g., 192.168.1.10:80).
- A listening socket is waiting for incoming connections on a specific port. For example, a web server creates a listening socket on port 80 to wait for browsers to connect.
- An established connection involves two sockets: one on the local machine and one on the remote machine.
The ss command is our window into viewing and analyzing all these sockets.
Core ss Commands for Everyday Use
Your goal is almost always to answer one of three questions:
- What services are listening for connections on this server?
- Who is currently connected to my services?
- What process is responsible for a specific network connection?
Let's learn the commands to answer these questions.
1. Listing Listening Sockets
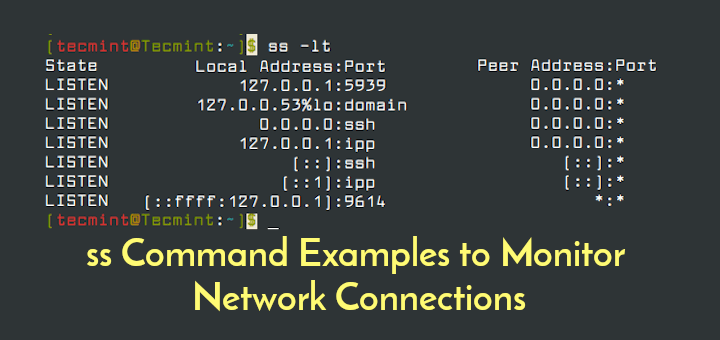
This is the most common use case. You want to verify that your service (e.g., a web server, database, or SSH daemon) has started correctly and is ready to accept connections. The key flags are:
-l: Show only listening sockets.-t: Show TCP sockets.-u: Show UDP sockets.-n: Show numeric port numbers instead of service names (e.g.,80instead ofhttp). This is faster and often clearer.
To see all listening TCP sockets with numeric ports, you combine these flags:
ss -ltn
2. Listing All TCP Connections
To see both listening sockets and active, established connections, you use the -a (all) flag.
ss -atn
When you run this, you will see sockets in the LISTEN state as before, but you'll also see sockets in the ESTAB (established) state. For these established connections, the Peer Address:Port column will show the IP address and port of the client that is connected to your server.
3. Identifying the Process
This is the most powerful feature for troubleshooting. Knowing a port is open is good, but knowing which process opened it is critical. The -p flag shows the process using the socket.
Let's combine it with our previous command to find the processes behind our listening TCP sockets:
ss -ltnp
The output will now include a users column, which looks something like (("sshd",pid=1234,fd=3)). This tells you that the sshd process with process ID 1234 is responsible for this listening socket. Now you know exactly what's running on that port.
A Practical Scenario
Let's put this into practice. Imagine you've just started a Python web server for a simple application.
-
Open a terminal and run the following command to start a web server on port 8000. (If you have two terminals available, run this in one and the
sscommands in the other. If not, you can run it in the background by adding an&at the end).python3 -m http.server 8000 -
Now, in another terminal, let's verify it's listening. We'll use
grepto quickly find port 8000.ss -ltn | grep 8000You should see a line showing a socket in the
LISTENstate on*:8000. -
Let's find out which process is responsible.
ss -ltnp | grep 8000The output will now show you that a
python3process is the one listening on port 8000, confirming your application is running as expected.
Test your understanding!
You are troubleshooting a server and you suspect an unauthorized service is running on port 5432, which is typically used by the PostgreSQL database. You run ss -ltnp | grep 5432 and see the process is (("postgres",pid=...)).
What if you ran the command and the output showed (("some_malware",pid=...))? What does this tell you, and why is the -p flag so important in this scenario?
Show answer
If the output showed some_malware, it would mean that a malicious program, not the legitimate PostgreSQL database, has opened port 5432. The -p flag is crucial here because it moves you beyond simply knowing the port is open to identifying the exact process using it. Without -p, you might assume the PostgreSQL service is running, but with it, you've identified a serious security issue.
Advanced Filtering
On a busy server, the output of ss can be overwhelming. The true power of ss comes from its advanced filtering capabilities.
Let's return to the 'How To Use Linux SS Command' article to learn about filtering.
Read through the examples under the headings 'List All Connections' through 'Filter Connections'. Pay close attention to the syntax for filtering by destination (dst), source (src), and port numbers.
Here are some of the most useful filters:
-
Filter by State: You can filter for any TCP state (e.g.,
established,syn-sent,time-wait). This is very useful for diagnosing connection lifecycle issues.# Show all established TCP connections ss -t state established -
Filter by Destination Port: Find all connections going to a specific service.
# Show all connections to any web server on the standard HTTPS port
ss -t dst :443
You can also use the service name:
ss -t dst :https -
Filter by Source/Destination IP: Isolate traffic from or to a specific machine.
# Show all connections from the IP 198.51.100.50 ss src 198.51.100.50 -
Combining Filters: You can create complex queries using
and,or, and().# Show all established connections to either port 80 or port 443 ss -t state established '( dport = :80 or dport = :443 )'(
dportmeans destination port).
For an exhaustive list of possible TCP states you can filter by, the cyberciti.biz article "ss command: Display Linux TCP / UDP Network/Socket..." is a great reference. Specifically, look at its section titled "How Do I Filter Sockets Using TCP States?".
Conclusion
You have now learned how to use ss, a critical tool for any DevOps engineer or system administrator. You can now confidently answer questions about the network state of your applications directly on the server.
Key Takeaways:
ssis the modern, fast tool for inspecting network socket statistics, replacing the oldernetstat.- The most common and powerful command combination is
ss -ltnp, which shows you all listening TCP sockets with numeric ports and the processes using them. - Use
-ato see all sockets, including those in theESTAB(established) state. ssallows for powerful filtering by state (state established), destination (dst :443), source (src 1.2.3.4), and more, allowing you to zero in on the information you need on a busy system.
In this lesson, we've seen who is talking on the network by looking at sockets and processes. But what if you need to know what they are saying? In our next lesson, we will dive even deeper by learning how to capture and perform a basic analysis of network traffic using tcpdump. This will allow us to see the raw data packets being exchanged between services.