Hello! Welcome to your final lesson in the "Linux System Administration Essentials" module.
In our last session, you mastered scheduling one-time and recurring tasks with at and cron. A crucial part of automation is verifying that your scheduled jobs ran correctly and troubleshooting them when they don't. How do you do that? By checking the logs.
Today, we'll dive into this essential skill. Our learning outcome is to analyze system logs using journalctl and traditional log files in /var/log. For a DevOps engineer, logs are the system's "black box"—they tell you what happened, when it happened, and why. Mastering log analysis is fundamental for debugging applications, monitoring security, and ensuring your infrastructure is healthy.
We will explore the two primary logging systems in modern Linux:
- Traditional Log Files: The classic, plain-text files stored in the
/var/logdirectory. - The
systemdJournal: A modern, structured logging system accessed with the powerfuljournalctlcommand.
Let's get started.
The Big Picture: How Linux Logging Works
Before we look at commands, it helps to understand where logs come from. A Linux system is constantly generating messages from the kernel (about hardware and system state) and from user-space applications and services (like SSH, cron, or a web server). These messages need to be collected and stored.
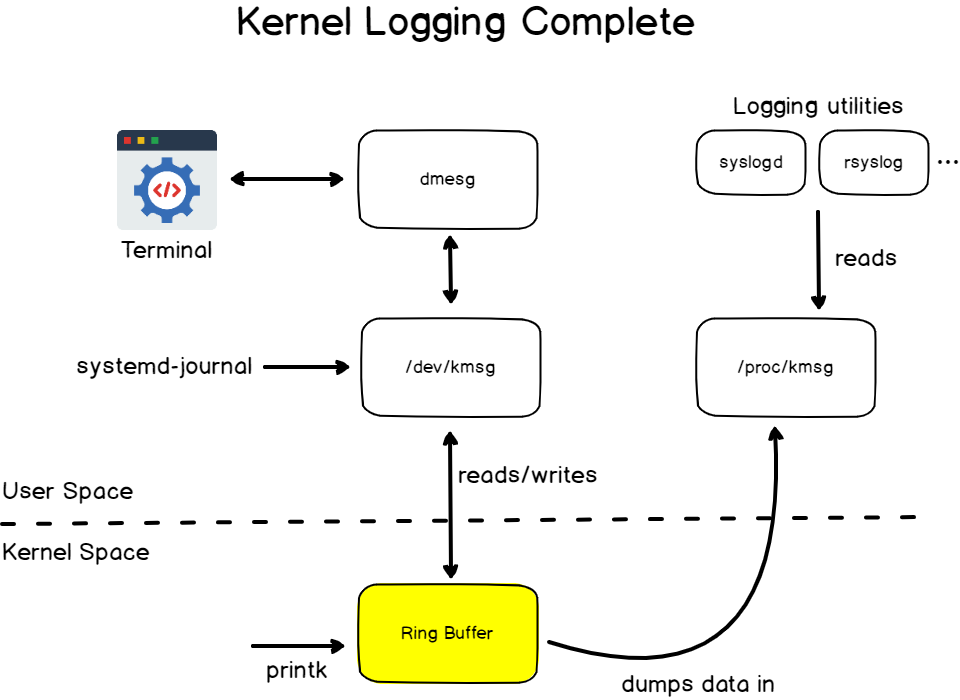

1. The Classic Approach: Traditional Logs in /var/log
For decades, the standard for logging on Linux and Unix systems has been to write plain-text files into the /var/log directory. Each file or subdirectory typically serves a specific purpose.
To get a great overview of this system, including how log file names can differ between Linux families (like Red Hat vs. Debian), let's watch the first part of the following video.
Linux Crash Course - Understanding Logging
This video from Learn Linux TV provides an excellent introduction to the /var/log directory, demonstrates how to view common log files, and explains the important difference between text and binary logs.
Please watch from the beginning up to 18:57. This will cover: 00:00 - 03:48: Introduction to /var/log and the variation in log names across distributions. 03:48 - 07:36: Exploring specific text-based logs like boot.log and dnf.log (package manager log on Fedora). 07:36 - 11:48: Understanding binary logs (wtmp, btmp) and using special commands (last, lastb) to read them. 11:48 - 18:57: Switching to an Ubuntu system to see its equivalent logs, like auth.log (for authentication) and syslog (for general messages). This part contains a great demonstration of using tail -f for real-time monitoring. 18:57 - 24:26: This section covers APT and dmesg logs, which are also very useful.
Key Log Files in /var/log
As you saw in the video, different Linux distributions might name their log files slightly differently. Here is a table summarizing the most common ones. This is also covered well in the article "Log Management with journalctl and /var/log" under the section "Classic Logs in /var/log/".
| Log File (Debian/Ubuntu) | Log File (Red Hat/CentOS) | Purpose |
|---|---|---|
/var/log/syslog |
/var/log/messages |
General system-wide messages and events. A good first place to look. |
/var/log/auth.log |
/var/log/secure |
Authentication events: logins, sudo usage, SSH connections, failed passwords. Crucial for security audits. |
/var/log/kern.log |
(Part of messages) |
Kernel-specific messages. |
/var/log/dmesg |
/var/log/dmesg |
Kernel ring buffer messages, primarily related to hardware detection during boot. |
/var/log/boot.log |
/var/log/boot.log |
Messages related to the system startup process. |
/var/log/apt/history.log |
/var/log/yum.log |
History of software package installations, updates, and removals. |
/var/log/cron |
/var/log/cron |
Logs the execution of scheduled cron jobs. |
Tools for Reading Text Logs
You already know most of these! The power comes from combining them.
less /var/log/syslog: View a large log file with pagination.tail /var/log/auth.log: See the last 10 lines of the authentication log.tail -f /var/log/auth.log: Follow the log in real-time. This is extremely useful for live troubleshooting.grep "Failed password" /var/log/auth.log: Search for specific patterns within a log file.grep "CRON" /var/log/syslog | tail -n 20: Find all lines related tocronin the system log and show only the last 20. This is how you can check if your scheduled jobs ran!
Test your understanding!
You scheduled a daily backup script using cron in the last lesson. You suspect it might not have run last night. Which command would be the most direct way to check the logs for this?
Show answer
grep CRON /var/log/syslog (on Debian/Ubuntu) or cat /var/log/cron (on Red Hat/CentOS).
grep is often more useful because it can search through rotated log files as well (e.g., grep CRON /var/log/syslog*).
2. The Modern Approach: systemd and journalctl
Most modern Linux distributions use systemd as their init system. One of systemd's core components is the journal, a centralized and structured logging service. Instead of writing to many different text files, all logs—from the kernel, services, and applications—are collected by the journald daemon and stored in a binary format.
You interact with the journal using the journalctl command.
Why journalctl?
- Centralized: All logs are in one place.
- Structured Data: Each log entry is tagged with metadata (e.g., the service it came from, its priority, the process ID).
- Powerful Filtering: You can easily filter logs by service, time range, priority, and more, which is much harder with plain text files.
This next video gives a focused tutorial on the most important features of journalctl.
journalctl Basics: How to Easily Check Your Linux Logs
Now that you understand traditional logs, let's focus on the modern standard. This video, also from Learn Linux TV, is a dedicated guide to using journalctl for effective log analysis.
Please watch from 04:10 to 15:23. This part of the video is highly practical and covers the core commands you'll use daily: 04:10 - 05:35: Basic usage and the -f (follow) option for real-time viewing. 05:35 - 11:23: The -u (unit) option to filter by a specific service (e.g., sshd). This is one of the most powerful features for a DevOps engineer. 11:23 - 15:23: Filtering by time with --since and --until, using both absolute and relative time expressions (like 'yesterday' or '1 hour ago').
Core journalctl Commands
The video you just watched demonstrated the essentials. Here's a quick-reference summary. For an even more detailed command list, you can refer to the "Log Management with journalctl" article.
Log Management with `journalctl` and `/var/log` in Red Hat ...
This article from dev.to is a fantastic cheat sheet for both journalctl and traditional log commands. It's a great resource to bookmark.
Review the section titled 'Exploring journalctl (systemd Logs)'. It provides a concise list of the most common filtering options, including by service, time, and priority.
Common journalctl Commands:
journalctl: View all logs (from oldest to newest).journalctl -f: Follow logs in real-time.journalctl -n 50: Show the last 50 log entries.journalctl -u sshd: Show all logs specifically from thesshdservice.journalctl -u nginx --since "10 minutes ago": Show Nginx logs from the last 10 minutes.journalctl -b: Show all logs from the current system boot. Use-b -1for the previous boot.journalctl -p err: Show all logs with a priority of "error" or higher (err, crit, alert, emerg).journalctl -k: Show only kernel messages (similar to thedmesgcommand).
Practical Scenarios: When to Use Which
So, when do you use journalctl versus peeking into /var/log?
- "My Nginx web server won't start."
- Best tool:
journalctl -u nginx.service. This isolates logs to just the service you're debugging. Adding-xe(journalctl -xe -u nginx.service) can give even more detailed error information.
- Best tool:
- "Did someone try to SSH into my server last night?"
- Both work!
grep "sshd" /var/log/auth.logis a classic.journalctl -u sshd --since yesterdayis the modern, potentially more precise way.
- Both work!
- "My custom application is failing, and it writes its logs to
/var/log/my-app/error.log."- Best tool:
tail -f /var/log/my-app/error.log. Since this application doesn't log to the journal, you must use the traditional text file.
- Best tool:
- "The system just rebooted unexpectedly. Why?"
- Best tool:
journalctl -b -1 -p 3. This shows you logs from the previous boot (-b -1) with a priority of critical or higher (-p 3or-p crit). This can quickly point you to the failure that occurred right before the crash.
- Best tool:
Conclusion
You have now added a critical diagnostic skill to your DevOps toolkit. You can confidently investigate system behavior, security events, and application errors.
Key Takeaways:
- Linux has two main logging systems: traditional text files in
/var/logand thesystemdjournal. - Use commands like
tail,less, andgrepto read and search through files in/var/log.tail -fis essential for live troubleshooting. - Key traditional logs include
/var/log/syslog(general),/var/log/auth.log(security), and/var/log/apt/history.log(packages). journalctlis the powerful command-line tool for querying thesystemdjournal.- The real power of
journalctllies in its filtering capabilities: by unit (-u), time (--since), priority (-p), and boot (-b). - For debugging
systemdservices like Nginx or SSH,journalctl -u <service>is your go-to command.
This lesson concludes our module on Linux System Administration Essentials. You've built a strong foundation, from managing services and users to scheduling tasks and now, analyzing logs.
Our next module, "Networking Fundamentals for DevOps," begins with a lesson on the OSI model. Understanding how data flows across a network is the first step toward configuring and troubleshooting the complex, interconnected systems you'll be managing as a DevOps engineer.