Hello! Welcome to the final lesson in our module on atmospheric moisture and precipitation.
In our last session, we investigated the three primary "engines" that lift air to create clouds and rain: convection, orographic lift, and frontal systems. We now understand how precipitation is generated on a large scale.
Today, we will connect those mechanisms to the where and how much of precipitation. Our goal is to interpret rainfall distribution maps and analyze precipitation data. We'll move from the global scale, looking at why some parts of the world are deserts and others rainforests, down to the local scale, learning how to read and analyze the climate data for a specific place. This lesson will bring together many of the concepts we've covered in climatology and apply your interest in mapping.
1. The Global Pattern of Precipitation
The amount of precipitation a place receives is not random. It's governed by the global circulation patterns, temperature zones, and landforms we've been studying.
Let's start by looking at a map of the world's average annual precipitation. Take a moment to examine the patterns. Where are the wettest areas? Where are the driest?
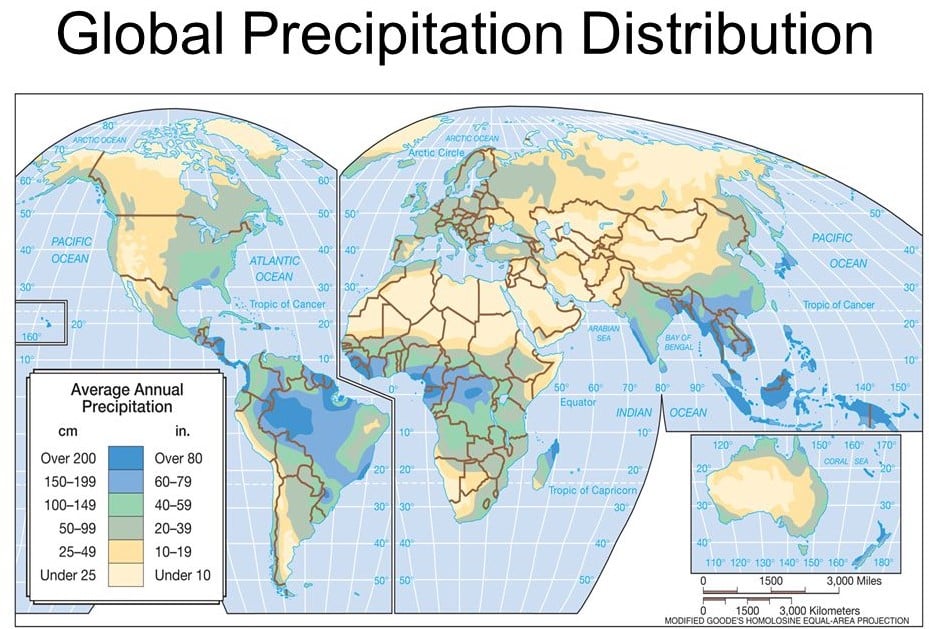
You can immediately see that rainfall is distributed unevenly. There's a prominent belt of very high rainfall near the equator, while vast deserts exist around the 30° latitude lines.
To understand the reasons behind these patterns, let's watch a video that connects this map to the atmospheric processes we've learned about.
Rainfall | Types and World Distribution of Rainfall | Climatology | Dr. Krishnanand
This video, from Dr. Krishnanand of TheGeoecologist, provides an excellent explanation of the factors controlling global rainfall distribution. It will help us interpret the patterns on the map.
Please watch the section on the distribution of rainfall, from 13:28 to 19:02. Focus on how rainfall patterns are related to: Latitude (equator vs. poles) Location within a continent (coastal vs. interior) Prevailing winds (in the subtropics vs. mid-latitudes) Mountain ranges
The video provides a clear framework for understanding the "Global Average Annual Precipitation" map. Let's summarize the key principles:
- Equatorial Regions: The intense solar heating at the equator fuels constant convection, leading to the heavy rainfall you see in the Amazon, the Congo Basin, and Southeast Asia. This is the Inter-Tropical Convergence Zone (ITCZ), which we know as a low-pressure belt.
- Subtropical Regions (approx. 30° N/S): This is the zone of the subtropical high-pressure belts. Here, air descends, warms, and dries out, preventing cloud formation. This is why many of the world's great deserts (Sahara, Kalahari, Australian Outback) are found in this belt, especially on the western sides of continents.
- Mid-Latitudes (approx. 45°-65° N/S): In this zone, the prevailing winds are the westerlies, which blow from west to east. As the video explained, they bring moist air from the ocean to the western coasts of continents (e.g., the Pacific Northwest of North America, Western Europe). As you move inland, the precipitation decreases.
- Coastal vs. Interior: Coastal areas are generally wetter than continental interiors because of their proximity to the moisture source (the ocean).
- Mountain Barriers: As we learned in the last lesson, orographic lift causes heavy rain on the windward side of mountains and creates a dry "rain shadow" on the leeward side. Look at the west coast of North America on the map; you can see high precipitation along the coastal mountain ranges. The area just to the east is significantly drier.
2. Representing and Analyzing Precipitation Data
While global maps give us the big picture, we often need to analyze the climate of a specific location. Geographers and climatologists use several tools for this.
The Climograph
One of the most common tools is a climograph, also known as a climate graph. It's a simple, powerful chart that shows a location's average monthly temperature (as a line graph) and average monthly precipitation (as a bar graph).
Climate Graphs Explained (and how to make one)
This video from Simple Geography clearly explains what a climograph is, how to make one, and most importantly, how to interpret it.
Please watch the video from the beginning to 01:07, and then from 02:02 to the end (06:09). The first part introduces the concept, and the second part shows how to read the precipitation bars and how different patterns relate to different climates (rainforest, desert, etc.).
By looking at a climograph, you can quickly understand the climate of a place. Is it hot and wet all year? Is there a distinct dry season? Let's look at an example.

By analyzing this climograph, we can deduce:
- Temperature: The red line is high and nearly flat, telling us it's hot all year round with very little seasonal variation.
- Precipitation: The blue bars are tall in every month, indicating heavy rainfall throughout the year. There is no dry season.
This pattern is characteristic of the equatorial regions we identified on the world map. The video also showed climographs for deserts, where the blue bars would be very low all year.
Isohyet Maps
For a more detailed spatial view of rainfall over a region, we use isohyets. This is a term that builds on concepts you've seen before: just as an isotherm connects points of equal temperature and an isobar connects points of equal pressure, an isohyet connects points of equal precipitation.
This concept is central to mapping and analyzing rainfall patterns.
What are Isohyets and when are they used? - Lewis - Medium
This article from Medium provides a clear definition of isohyets and explains their practical importance in fields like hydrology and planning.
Please read the sections 'Introduction,' 'Understanding Isohyets,' 'Role of Isohyets in Hydrology,' and 'Flood Risk Assessment.' Focus on what an isohyet is and how these maps are used to visualize rainfall and assess water resources.
From the reading, we learn that isohyets are lines drawn on a map to create contours of rainfall. These maps are not just academic; they are critical for:
- Visualizing distribution: Seeing at a glance where the rain falls.
- Water resource management: Deciding where to build reservoirs or plan irrigation.
- Flood risk assessment: Identifying areas prone to flooding after heavy rainfall.
Creating an isohyet map involves taking data from rain gauges at different points and then using statistical methods (a process called interpolation, which you'll encounter in GIS) to draw the lines between the points.
Test your understanding!
Look at the "Global Average Annual Precipitation" map again. Imagine you are a water resource planner in India. The Western Ghats are a mountain range running along the west coast. Prevailing monsoon winds blow from the southwest (from the ocean). Based on your knowledge of orographic rainfall and by observing the map, where would you expect to find the highest rainfall and thus the best potential for hydroelectric power dams: on the west or east side of the Western Ghats?
Show answer
You would expect to find the highest rainfall on the western side of the Western Ghats. The map confirms this with a dark blue band along India's southwest coast. The moist monsoon winds from the Arabian Sea are forced to rise up the western (windward) slopes, causing immense orographic precipitation. The eastern side, being in the rain shadow, receives significantly less rain. Therefore, the best potential for hydroelectric dams that rely on heavy, consistent rainfall would be on the rivers flowing down the western slopes.
3. A Deeper Look at Precipitation Data
When we talk about "average annual precipitation," what does that really mean? And what information does an average hide? To truly analyze data, we need to understand a bit about how it's processed.
The Climate Atlas of Canada has an excellent guide on interpreting climate data. We'll read a few sections to understand the concepts of climatic averages and variability, which are crucial for any data analysis in geography.
Please read the sections titled 'Mean Values' and 'Range and Distribution.' These sections explain why scientists use 30-year averages to define a 'climate' and why it's also important to consider the variation (the range) in the data, not just the average.
This reading introduces two vital statistical concepts for analyzing any climate data, including precipitation:
-
Mean (Average) over Time: As the article states, scientists use a 30-year average by convention. This long-term average smooths out the short-term, year-to-year fluctuations of weather to reveal the underlying, stable pattern of a region's climate. When you see a map like the global precipitation map, you are looking at such a long-term average.
-
Range and Distribution: The average doesn't tell the whole story. Two places could have the same average annual rainfall, but one might get it in consistent showers throughout the year, while the other gets it in a few extreme downpours with long dry spells in between. Understanding the range (the highest and lowest values) and distribution (how often different amounts of rain occur) gives a much more complete picture of a region's precipitation patterns.
Conclusion
In this lesson, we have learned how to read, interpret, and analyze precipitation patterns and data. We have successfully bridged the gap between the physical processes that cause rain and their geographic expression on a map.
Key Takeaways:
- Global rainfall distribution is not random but is controlled by latitude-dependent heating, global pressure belts, prevailing winds, and topography.
- Climographs are essential tools for visualizing and analyzing the monthly temperature and precipitation data of a specific location, revealing its climate type.
- Isohyet maps use contour lines to show the spatial distribution of rainfall over an area, which is vital for water management and hazard assessment.
- Analyzing precipitation data requires understanding statistical concepts like the use of 30-year means to define climate and the importance of range and variability to understand the full character of a region's rainfall.
Preview of the Next Lesson:
We've now completed our module on atmospheric moisture and precipitation. We repeatedly encountered concepts like frontal lifting and cyclones. To understand these complex weather systems in detail, we first need to master their fundamental building blocks. Therefore, in our next lesson, we will begin a new module, "Weather Systems and Storms," by formally defining an air mass and learning how to classify the different types based on where they originate.