Hello! Welcome to the second module of our course, "Foundations of Cartography: Reading and Interpreting Maps."
In our last lesson, we concluded our study of Earth's foundational grid by exploring the geographic graticule. We learned that this network of latitude and longitude lines is the fundamental framework that gets mathematically projected onto a flat surface to create every map we use.
Now that we understand how maps are made in principle, it's time to explore the vast world of maps themselves. Not all maps are created equal; they are designed with specific goals in mind. This lesson will equip you to recognize different map types and understand their unique purposes. Our learning outcome is to differentiate between various types of maps (e.g., topographic, thematic) and their purposes.
We will begin by learning the most fundamental distinction between maps, then explore several important examples within each category.
1. The Two Main Families of Maps: Reference and Thematic
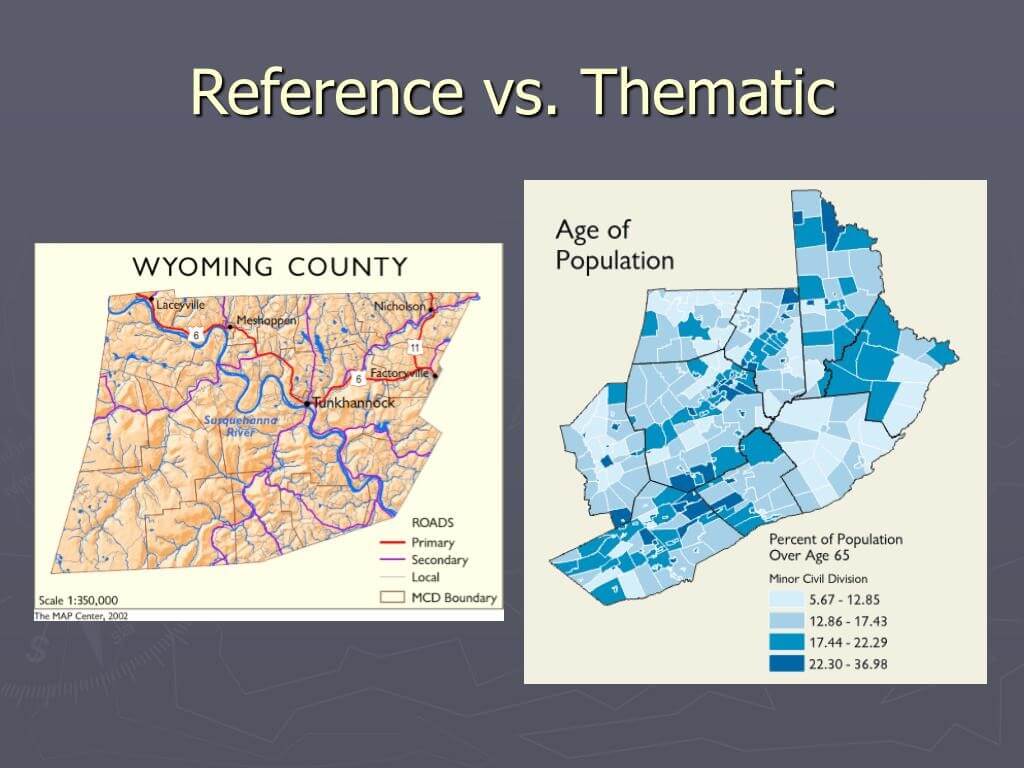
At the broadest level, virtually all maps can be sorted into two main categories based on their primary function: reference maps and thematic maps.
- Reference Maps are designed to show the location of geographic features. Their goal is to provide a general-purpose summary of the landscape. They answer the question, "Where is it?" Examples include road atlases and wall maps showing cities, borders, and rivers.
- Thematic Maps are designed to show the spatial pattern of a specific topic or "theme." Their goal is to tell a story about how a particular phenomenon is distributed across a space. They answer the question, "What is the pattern of this data?" Examples include maps of population density, rainfall distribution, or election results.
To see a clear, side-by-side comparison, examine the image below.
Now, let's watch a short, dynamic video that explains this core distinction and introduces a few examples.
What is a Map? Crash Course Geography #2
The Crash Course Geography video 'What is a Map?' provides a quick and clear explanation of reference and thematic maps, setting the stage for our deeper exploration.
Please watch from 01:33 to 02:32. Focus on how the narrator defines and contrasts reference maps (what's there) with thematic maps (visualizing data about a topic).
This fundamental difference—showing location versus showing a pattern—is the key to understanding why different maps look the way they do.
2. A Closer Look at Reference Maps
Reference maps serve as our geographic dictionary. They provide foundational context by showing us where things are. Let's explore a few key types.
Types of Maps: Political, Physical, Google, Weather, and ...
The article 'Types of Maps' from Geology.com gives straightforward descriptions of several common reference maps. We will use it to define political, physical, and topographic maps.
Please read the sections titled 'Political Maps', 'Physical Maps', and 'Topographic Maps'. For each one, focus on its main purpose and the types of features it displays.
Based on your reading, let's summarize the key types of reference maps:
- Political Maps: Their primary purpose is to show human-created boundaries, such as those between countries, states, and counties. They often include major cities and bodies of water for context.
- Physical Maps: Their purpose is to show the natural features of the Earth's surface. They emphasize landforms like mountains, plateaus, and valleys, often using color and shading to represent elevation.
- Topographic Maps: This is a very specific and detailed type of reference map. Its defining purpose is to show the precise shape and elevation of the land using contour lines—lines that connect points of equal elevation. Because of their accuracy, they are essential for engineers, hikers, geologists, and military personnel who need to analyze terrain in detail.
It's important to note that many maps are hybrids. For example, a physical map will often include major political boundaries to help orient the user. The key is to identify the map's primary purpose.
3. The Power of Thematic Maps: Visualizing Data
Thematic maps are where cartography becomes a powerful tool for analysis and storytelling. By layering data onto a base map, geographers can reveal patterns that would be invisible in a table of numbers.
One of the most famous historical examples is Dr. John Snow's map of a cholera outbreak in London in 1854. By plotting the locations of cholera deaths on a street map (a thematic map!), he identified a contaminated water pump as the source of the epidemic, a groundbreaking discovery in public health.
Thematic maps use various techniques to visualize data. Let's watch a few clips that introduce some of the most common types.
What is a Map? Crash Course Geography #2
We'll return to the Crash Course video to learn about three common types of thematic maps: choropleth maps, dot density maps, and cartograms.
Please watch from 02:32 to 05:19. As you watch, note how each of the following map types represents data: Choropleth map: How does it use color? Dot density map: What does each dot represent? Cartogram: What is being distorted and why?
Let's review these and add a couple more important types.
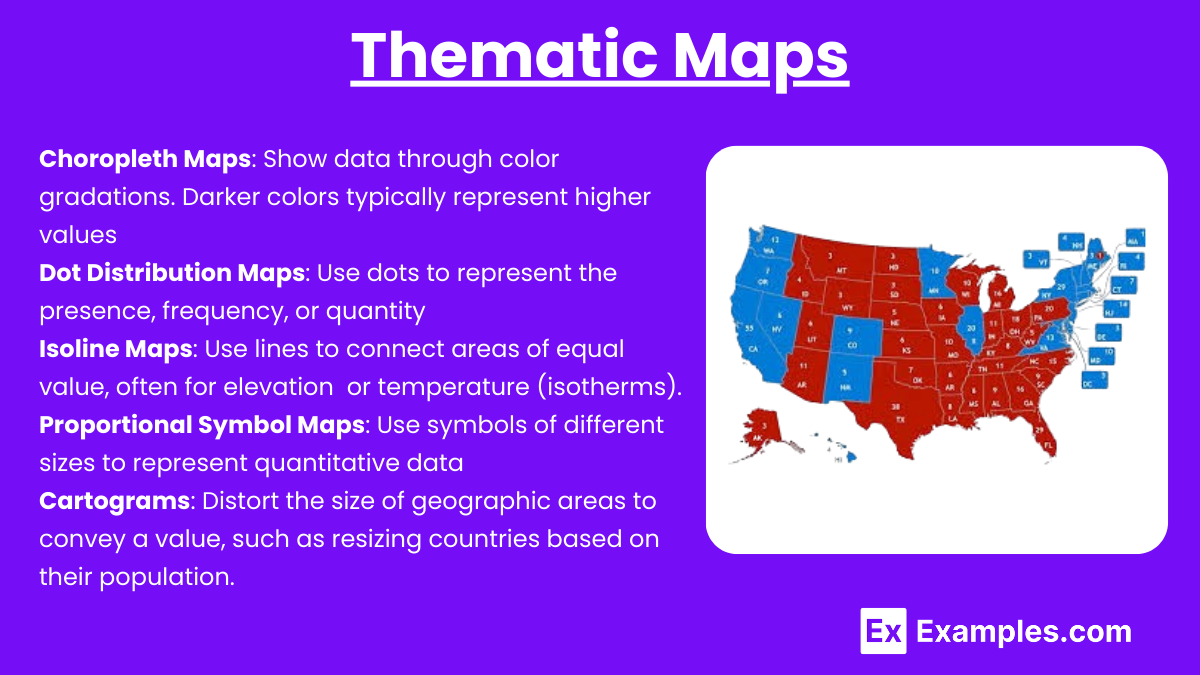
- Choropleth Maps: Use color or shading to represent the value of data within predefined areas (e.g., countries, states, counties). The population density map you saw earlier is a classic example.
- Dot Density Maps: Use dots to represent a specific quantity of a feature. More dots in an area mean a higher concentration of that feature.
- Proportional Symbol Maps: Use symbols (like circles or squares) of different sizes to show the magnitude of a variable at a specific location. A larger symbol means a larger value.
- Isoline Maps: Use lines to connect points of equal value. Topographic maps are a type of reference map, but their contour lines are a perfect example of isolines (lines of equal elevation). Other examples include isotherms (equal temperature) and isobars (equal atmospheric pressure) on weather maps.
- Cartograms: Distort the geographic size of areas to be proportional to the value of the data they represent. They are visually striking but sacrifice geographic accuracy to emphasize a statistical pattern.
Test your understanding!
You are given three different mapping tasks. For each task, identify the most appropriate map type (e.g., political, topographic, choropleth) and explain why.
- You need to plan a multi-day hiking trip through a mountainous national park and want to avoid slopes that are too steep.
- You are a journalist writing an article about income inequality across the United States and want to show which states have a higher or lower median household income.
- You are working at the United Nations and need a map to show the member countries of a new international treaty.
Show answer
- Topographic Map: This is the best choice because its contour lines provide detailed information about elevation and slope, allowing you to identify steep and gentle terrain for your hike.
- Choropleth Map: This map type is ideal for showing how a statistical value (median household income) varies across predefined areas (states). Each state would be colored according to its income bracket.
- Political Map: A simple political map of the world is most appropriate. Its primary purpose is to show country boundaries, making it easy to color or highlight the specific countries that are members of the treaty.
Conclusion
In this lesson, we've established a foundational framework for understanding the diverse world of maps. You learned how to classify maps based on their primary purpose, distinguishing between those that show where things are and those that show the pattern of a theme.
Key Takeaways:
- Maps are broadly categorized as reference or thematic.
- Reference maps (like political, physical, and topographic maps) serve as general-purpose guides to the location of features.
- Thematic maps (like choropleth, dot density, and isoline maps) are designed to visualize the spatial distribution of a specific dataset, turning data into a geographic story.
- The type of map a cartographer chooses depends entirely on the information they want to communicate.
Preview of the Next Lesson:
Now that you can identify different map types, our next step is to understand one of the most critical elements present on almost every map. In the next lesson, we will focus on the learning outcome: Explain the concept of map scale and calculate real-world distances from a map. Understanding scale is the key to connecting the representation on the page to the reality of the world.