Hello! Welcome to the sixth and final lesson in our module on the Foundations of Cartography.
In our previous lessons, we focused on how to represent a 3D landscape on a 2D topographic map using contour lines. We learned to calculate relief and slope, effectively translating the shape of the terrain from a flat sheet. Now, we are going to zoom out and tackle a much bigger problem: how do we represent the entire 3D, spherical Earth on a single flat map?
Today's lesson addresses the learning outcome: Explain the basic principles of map projections and the concept of distortion. We will uncover why every world map you've ever seen is, in some way, a distortion of reality. You'll learn what a map projection is and understand the fundamental trade-offs cartographers must make when creating maps. This is a core concept in geography and is essential for critically interpreting any map of the world.
1. The Fundamental Problem: Flattening the Globe
Imagine an orange. You can easily peel it, but can you lay that peel flat on a table without tearing or stretching it?
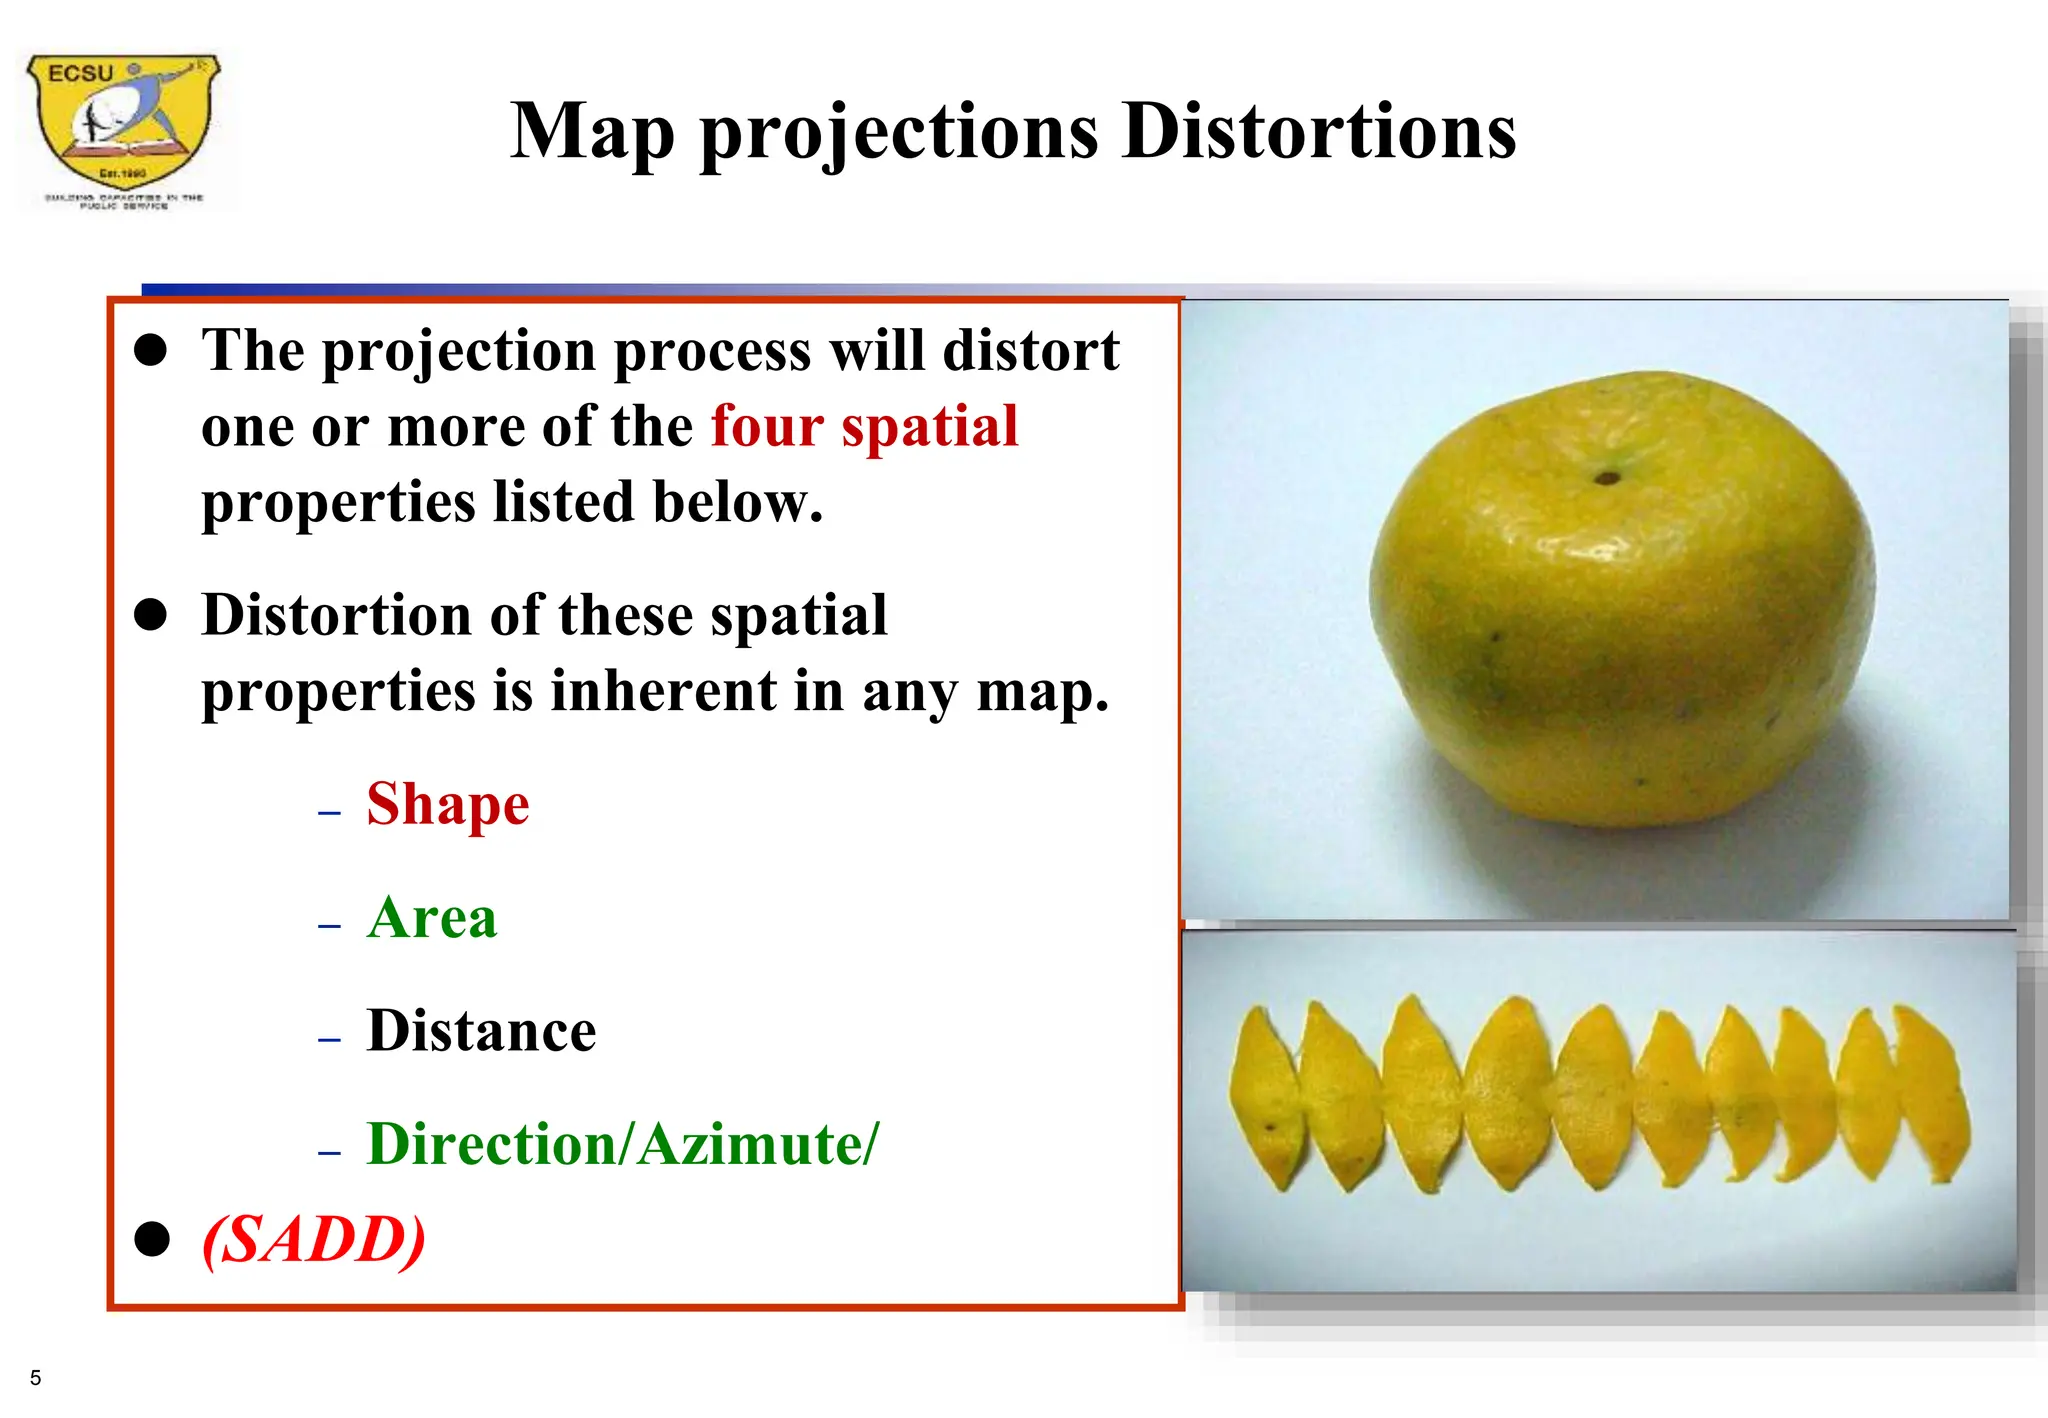
This simple analogy captures the central dilemma of map-making. A sphere is a non-developable surface, meaning it can't be unrolled into a flat plane. The mathematical proof for this was provided by Leonhard Euler in the 18th century. As a result, any attempt to project the 3D Earth onto a 2D surface will inevitably introduce distortion. This distortion affects one or more of four key properties:
- Shape
- Area (or size)
- Distance
- Direction
Remembering the acronym SADD can help you recall these properties.
To see this problem in action, let's watch the beginning of a video from Vox titled 'Why all world maps are wrong'. It does an excellent job of visually demonstrating why a globe cannot be perfectly flattened.
Watch the first 46 seconds of the video. Notice the stretching and tearing required to even attempt to make the globe's surface lie flat. This visualizes the unavoidable distortion we've just discussed.
2. What is a Map Projection?
Since we can't perfectly flatten the globe, we need a systematic method for transferring the geographic grid of latitude and longitude from the Earth's surface onto a flat plane. This method is called a map projection.
Map Scale, Coordinate Systems, and Map Projections
This reading from 'Essentials of Geographic Information Systems' introduces the concept of map projections and the classic analogy used to understand them.
Read the section titled 'Map Projections'. Focus on the definition of a map projection and the analogy of a light bulb inside a translucent globe. This will give you a strong mental model for how projections work.
As you just read, a map projection is essentially a mathematical formula. The "light bulb" analogy is helpful for visualizing the general principle. Cartographers imagine projecting the features of the Earth onto different shapes that can be unrolled into a flat surface. The three most common shapes, or projection surfaces, are the cylinder, the cone, and the plane.

To see how these different surfaces work and how they influence the final map, let's watch another short video.
Map Projections Overview and How They Distort the Earth
This video from Geography King, 'Map Projections Overview', clearly explains the three main methods of projection.
Watch from 01:45 to 02:42. The video will walk you through how cylindrical, conical, and planar projections are conceptually created. Pay attention to the general pattern of distortion each one produces.
- Cylindrical Projections: Imagine wrapping a cylinder of paper around the globe. These projections are good for mapping the entire world but cause significant distortion (stretching) of area near the poles.
- Conical Projections: Imagine placing a cone over one of the poles. These are best for mapping mid-latitude regions that have a greater east-west extent, like the United States or Russia.
- Planar (or Azimuthal) Projections: Imagine placing a flat sheet of paper against a single point on the globe. These are often used for mapping polar regions or showing airline routes from a central point.
3. The Inevitable Trade-off: Types of Distortion
Since every projection distorts something, a cartographer's choice of projection is always a compromise. The best projection depends entirely on the purpose of the map. A map designed for ocean navigation has very different needs from a map designed to show the relative sizes of countries.
Projections are often classified by which property they preserve.
Conformal Projections: Preserving Shape
Conformal projections preserve local shapes and angles. This is crucial for navigation, where maintaining a correct bearing is essential. The trade-off is that the area of features becomes distorted. The most famous (and infamous) example is the Mercator projection.
Equal-Area Projections: Preserving Area
Equal-area (or equivalent) projections preserve the relative size of landmasses. This is vital for thematic maps that show distributions, such as population density or deforestation, where comparing the size of different regions is the main goal. The trade-off is that shapes become distorted (stretched or squashed). A well-known example is the Gall-Peters projection.
The same Vox video we started with has a fantastic segment comparing the Mercator and Gall-Peters projections. It clearly illustrates the trade-off between preserving shape and preserving area.
Watch from 01:33 to 03:49. Pay close attention to how Greenland and Africa are represented on each map. Notice how the dots placed on the globe change when projected onto the Mercator (shape preserved, size distorted) versus the Gall-Peters (size preserved, shape distorted).
Compromise Projections
Many modern world maps use compromise projections. These projections don't perfectly preserve any single property. Instead, they try to strike a balance, moderately distorting all four properties (shape, area, distance, direction) to create a map that looks more visually appealing and less distorted overall. The Robinson and Winkel Tripel projections are popular examples.
Visualizing Distortion: Tissot's Indicatrix
How can we visualize and measure this distortion across a map? A French mathematician named Nicolas Tissot developed a tool to do just that. The idea is to imagine drawing a series of identical small circles on the globe. When you project the globe onto a flat map, these circles are deformed into ellipses. The shape and size of these ellipses, called Tissot's Indicatrices, reveal the type and amount of distortion at any given point.
- On a conformal map (like Mercator), the ellipses are all circles, but they get larger as you move away from the equator, showing the massive area distortion.
- On an equal-area map, the ellipses all have the same area, but they are stretched into different shapes, showing the shape distortion.
A more intuitive way to see this is by projecting a familiar shape, like a human face, onto different projections.
This resource from the University of Twente shows how a human face is distorted by different projections. It's a powerful way to make the abstract concept of distortion very concrete.
Scroll down to the 'Examples' section and look at Figures 1 through 5. Compare the face in the Mercator projection (Figure 2), where the top and bottom are stretched vertically, with the face in the Equal Earth projection (Figure 4), which looks more balanced.
Test your understanding!
An airline pilot needs a map to navigate a flight path from Tokyo to San Francisco. A climate scientist needs a map to compare the area of ice melt in the Arctic to the area of the Amazon rainforest.
Should they use the same map? Why or why not? What type of projection (conformal or equal-area) would be most suitable for each person's task?
Show answer
They should not use the same map because their tasks require preserving different properties.
- The airline pilot needs a conformal projection (like the Mercator). For navigation, preserving angles and directions is critical. A straight line on a conformal map represents a line of constant bearing, which is easy to follow with a compass. The distortion of area is not a concern for this task.
- The climate scientist needs an equal-area projection. Their task is to accurately compare the sizes of two different regions. A conformal map like the Mercator would be misleading, as it dramatically exaggerates the size of the Arctic, making a comparison with the Amazon impossible. An equal-area map ensures that the visual representation of size is accurate.
Conclusion
Today, you have learned one of the most fundamental concepts in cartography: the challenge of representing a spherical world on a flat surface. You are now equipped to look at any world map not just as a picture, but as a deliberate construction with inherent strengths and weaknesses.
Key Takeaways:
- It is mathematically impossible to flatten a sphere onto a plane without introducing distortion.
- A map projection is a systematic method for transforming the globe's grid onto a flat surface.
- Projections inevitably distort one or more properties: Shape, Area, Distance, or Direction.
- The choice of projection is a compromise based on the map's purpose. Conformal maps preserve shape for navigation, while equal-area maps preserve size for accurate comparisons.
Preview of the Next Lesson:
In this lesson, we introduced the basic principles and trade-offs of map projections. In our next lesson, we will dive deeper and identify the properties preserved by different specific map projection types. We'll move beyond the general categories and look at how projections like Mercator, Lambert Conformal Conic, and Albers Equal Area are used in the real world and in modern Geographic Information Systems (GIS).