Hello! Welcome to the final lesson of your foundational course in Geography and GIS.
Over the past twelve modules, you have journeyed from the fundamental shape and motions of our planet to the intricate dynamics of its climate, the sculpting of its surface, and the powerful tools we use to map and analyze it. This lesson is the culmination of that journey.
In our last session, you mastered a complete hydrological workflow by delineating a watershed from a Digital Elevation Model. You learned how to chain together tools like Fill, Flow Direction, and Flow Accumulation to model how water moves across a landscape.
Today, we will leverage that knowledge and integrate it with concepts from across the entire course. Our learning outcome is to integrate physical geography knowledge with GIS tools to analyze an environmental scenario. We will do this by conducting a comprehensive, real-world case study: a flood risk assessment. This project is a perfect capstone, as it requires us to combine data and concepts from climatology (precipitation), geomorphology (slope and elevation), and hydrology (stream networks and land cover) within a GIS framework to solve a practical problem.
1. The GIS Project Framework
Every rigorous GIS analysis follows a structured process, from defining the problem to presenting the results. This systematic approach ensures the analysis is logical, repeatable, and clearly understood. For our case study, we'll follow these general steps:
- State the Problem: Identify areas at high risk of flooding within a specific geographic region.
- Acquire Data: Gather the necessary spatial data representing the key factors that contribute to flood risk.
- Process and Prepare Data: Use GIS tools to derive new datasets from our initial data (e.g., creating a slope map from an elevation model).
- Analyze the Data: Combine the various data layers using a structured methodology to calculate a final risk score.
- Visualize and Interpret Results: Create a final map that clearly communicates the areas of low, medium, and high risk.
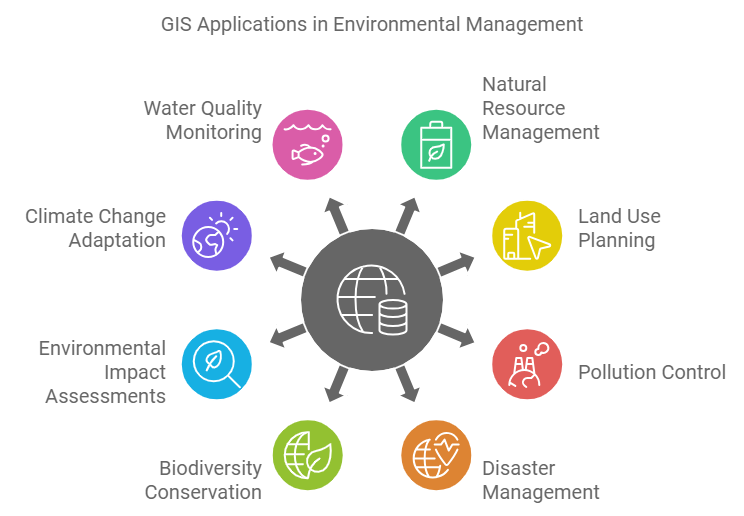
The core of our analysis will be a method called Multi-Criteria Evaluation (MCE). MCE is a powerful decision-making technique used in GIS to evaluate scenarios based on multiple factors. We will identify the key physical geography factors contributing to flood risk, create a data layer for each, and then combine them to produce a final flood risk map.

For our flood risk model, we will use five key factors, based on common hydrological practice:
- Elevation: Lower-lying areas are more susceptible to flooding.
- Slope: Flatter areas allow water to accumulate rather than drain away quickly.
- Precipitation: Areas with higher rainfall are more likely to experience flooding.
- Land Cover: The type of surface (e.g., forest, pavement, wetland) affects how much water is absorbed versus how much runs off.
- Proximity to Streams: Areas closer to existing rivers and streams are at a higher risk of inundation.
2. A Complete Walkthrough: Flood Risk Mapping
To guide us through this entire process, we will use a detailed video tutorial. While the video uses ArcGIS, the principles, tools, and workflow are conceptually identical to what you would do in QGIS or other professional GIS software.
How to Perform Hydrology Analysis and Flood Risk Mapping in ArcGIS? A Complete Tutorial.
The video 'How to Perform Hydrology Analysis and Flood Risk Mapping in ArcGIS?' from the HealthGIS channel provides a complete, end-to-end demonstration of our case study. We will break it down into manageable parts.
You don't need to watch it all at once. We'll proceed step-by-step, focusing on the geographical and analytical concepts, not just the specific clicks.
3. Part 1: Data Acquisition and Preparation
First, we need to gather and create the five data layers for our model.
Elevation and Slope
You are already familiar with Digital Elevation Models (DEMs) and how to derive a slope map from one. In our case study, the DEM and slope map are considered our starting data.
Precipitation Data
Climate data is a crucial input. The video demonstrates a standard method for obtaining global precipitation data.
How to Perform Hydrology Analysis and Flood Risk Mapping in ArcGIS? A Complete Tutorial.
Let's see how to acquire precipitation data from a widely used public source, WorldClim.
Watch the segment from 03:16 to 07:22. Pay attention to how the presenter downloads global monthly precipitation data and then uses a 'Clip' tool to extract the data for only their specific study area. This is a common and essential GIS task.
Deriving the Stream Network
Just as in our last lesson, the stream network isn't raw data; it's derived from the DEM. This part of the tutorial is an excellent practical review of the watershed delineation workflow.
How to Perform Hydrology Analysis and Flood Risk Mapping in ArcGIS? A Complete Tutorial.
This section of the video walks through the core hydrological modeling steps to extract stream channels from the DEM.
Watch from 10:28 to 24:18. Follow the logical sequence: Fill Sinks (10:28 - 14:02): Creating the hydrologically corrected DEM. Flow Direction (14:02 - 17:43): Calculating the path water will take from each cell. Flow Accumulation (17:43 - 22:30): Identifying cells with high concentrated flow, which represent the stream channels. Extracting Streams (22:30 - 24:18): Using the Reclassify tool on the flow accumulation raster to create a final stream network. The presenter uses a threshold to define what constitutes a stream (i.e., only cells with an accumulation value above a certain number are considered part of the network).
Calculating Proximity to Streams
Now that we have a stream network, we can calculate our final input factor: the distance of every location from the nearest stream.
How to Perform Hydrology Analysis and Flood Risk Mapping in ArcGIS? A Complete Tutorial.
This brief segment demonstrates a fundamental proximity analysis tool.
Watch from 24:18 to 26:10. The presenter uses the Euclidean Distance tool. The output is a raster where each cell's value is its straight-line distance to the nearest stream cell. Notice how areas directly on the streams have a value of zero, and the values increase as you move away.
At this point, we have all five of our input layers ready for analysis.
4. Part 2: The Core Analysis - Reclassification
This is the most important conceptual step in our MCE. We cannot directly combine elevation (in meters), slope (in degrees), and precipitation (in millimeters). The units and value ranges are incompatible. We must first standardize all layers by reclassifying them onto a common, unitless scale that represents flood risk.
The video uses a simple 1-to-10 scale, where a higher score means higher flood risk.
How to Perform Hydrology Analysis and Flood Risk Mapping in ArcGIS? A Complete Tutorial.
The next, lengthy segment of the video explains the logic and process for reclassifying each of the five input layers into risk scores. This is where we directly integrate our physical geography knowledge.
Watch carefully from 26:10 to 36:28. For each of the five factors, understand the logic of why certain values get a high risk score versus a low one: Elevation: Lower elevations are flatter and closer to the water table, so they are reclassified to a higher risk score (e.g., 10). Slope: Flatter slopes (<2 degrees) can't drain water effectively, so they get the highest risk score. Precipitation: Areas with the heaviest rainfall get the highest score. Proximity to Streams: Areas closest to the streams get the highest score. Land Cover: The presenter assigns scores based on the land cover type. For example, open water and wetlands are given the highest risk scores as they are naturally part of the drainage system. Developed areas are given a low score in this model. Note: One could also argue that impervious surfaces in developed areas increase runoff and thus flood risk. The logic for weighting can depend on the specific goals of the model.
This process of reclassification transforms our raw physical data into five separate layers, each representing a different facet of flood risk.
5. Part 3: Combining Layers and Interpreting the Result
With all our factors reclassified to the same risk scale, we can finally combine them. However, not all factors are equally important. For instance, being 1 meter away from a river might be a more significant risk factor than having a very gentle slope. We account for this using a Weighted Sum.
In a weighted sum (or weighted overlay), each reclassified risk layer is multiplied by a weight (a percentage) that reflects its importance in the overall model. The final risk score for each cell is the sum of all its weighted risk scores.
How to Perform Hydrology Analysis and Flood Risk Mapping in ArcGIS? A Complete Tutorial.
This section shows how to combine the five reclassified risk layers using a weighted sum to produce the final flood risk map.
Watch from 36:28 to 39:53. The presenter uses a 'Weighted Sum' tool. Notice the weights assigned: Precipitation: 35% Proximity to Streams: 30% Slope: 15% Elevation: 10% Land Cover: 10% These weights sum to 100%. The tool performs the calculation: Final Risk = (Precipitation_Risk * 0.35) + (Stream_Risk * 0.30) + ... for every pixel. The output is a single raster representing the overall flood risk.
The choice of weights is critical and is usually based on expert knowledge, local conditions, or statistical analysis. Different weights will produce different results.
Test your understanding!
Imagine you are creating a flood risk model for a very flat, coastal region where storm surge is the primary concern, not heavy rainfall. How might you adjust the weights used in the video's weighted sum analysis for this new scenario?
Show answer
In a flat, coastal region threatened by storm surge, the influence of elevation would be paramount. You would significantly increase the weight for Elevation (as very small differences in elevation determine inundation) and likely Proximity to the Coast (if that were a layer). Conversely, you would decrease the weights for Precipitation and Slope, as heavy rain and terrain-driven runoff are less critical factors compared to the surge from the sea.
Finally, the raw output of the weighted sum is a continuous raster of risk scores. For easier interpretation, it's common to classify this final map into categories like 'Very Low Risk', 'Low Risk', 'Medium Risk', 'High Risk', and 'Very High Risk', as shown in the final part of the video (00:39:53 - 00:41:52).
6. The Bigger Picture: From Analysis to Action
The flood risk map you have just learned to create is not just an academic exercise. It is a powerful tool for real-world planning and climate resilience. To understand how this kind of analysis fits into a broader context, let's briefly look at a conceptual framework.
Using GIS To Support Vulnerability And Risk Analysis In Climate Resilience Planning
This video, 'Using GIS To Support Vulnerability And Risk Analysis In Climate Resilience Planning', provides a high-level overview of how GIS analyses like ours are used by communities for decision-making.
Skim through the following segments to grasp the key concepts: Framework (07:56 - 09:55): Note the distinction between exposure (assets in harm's way), vulnerability (susceptibility to harm), and risk (probability and consequence). Exposure (09:55 - 11:30): This is the simple spatial overlay of assets (e.g., buildings) and hazards (e.g., a floodplain). This is the starting point of any risk analysis. Risk (13:17 - 14:24): The speaker defines risk by combining the probability of the threat (e.g., a 100-year flood vs. a 500-year flood) and the consequence. Risk Matrix (14:24 - 16:27): This is a key tool for decision-makers. It helps prioritize action by identifying assets that have both high vulnerability and high risk. Our flood map helps identify these high-risk areas.
This shows that the map we create is a crucial input for helping planners identify where to invest in flood defenses, update zoning regulations, or develop emergency response plans.
Conclusion
Congratulations on completing the final lesson and the entire course! You have successfully integrated knowledge from physical geography and practical skills in GIS to conduct a complete environmental analysis.
Key Takeaways:
- Multi-Criteria Evaluation (MCE) is a standard GIS methodology for analyzing complex problems by combining multiple data layers.
- A successful MCE requires a clear framework: defining the problem, selecting relevant criteria (factors), and acquiring the data.
- Reclassification is the essential step of standardizing all input layers to a common, unitless scale (e.g., a risk score) before they can be combined.
- A Weighted Sum is used to combine the reclassified layers, assigning more importance to more influential factors.
- The entire process, from data acquisition to final map, represents a geospatial model—a simplified representation of a real-world environmental process.
- The outputs of these models are not just maps, but critical inputs for environmental management, planning, and policy-making.
You began this course as a beginner and have systematically built a strong, foundational understanding of physical geography and the analytical tools used to study it. You are now equipped with the concepts and skills to explore the world through a geographic lens, to ask spatial questions, and to understand the methods used to answer them. Well done