Hello! Welcome back to our module on thematic mapping and GIS.
In our last lesson, we established the core principles of cartographic design. We explored how to create a clear visual hierarchy and use color and symbols deliberately to tell a story with a map. You learned to think like a cartographer, focusing on the map's purpose and the systematic process of its creation.
Today, we will build directly on that foundation. Instead of designing maps, we will focus on interpreting them. The goal of this lesson is to learn how to interpret various thematic maps—specifically choropleth, proportional symbol, and isoline maps—to identify spatial patterns. We will examine how each map type visualizes data differently and what kinds of stories each is best suited to tell. This is a crucial skill for anyone studying geography, as it allows you to extract meaningful information from the most fundamental tools of the discipline.
1. Identifying Spatial Patterns
Before we look at specific map types, let's clarify what we mean by "spatial pattern." When you interpret a thematic map, you are not just reading individual values; you are looking for the overall geographic arrangement of the data. Does the data form clusters? Is it spread out evenly? Is there a linear trend?
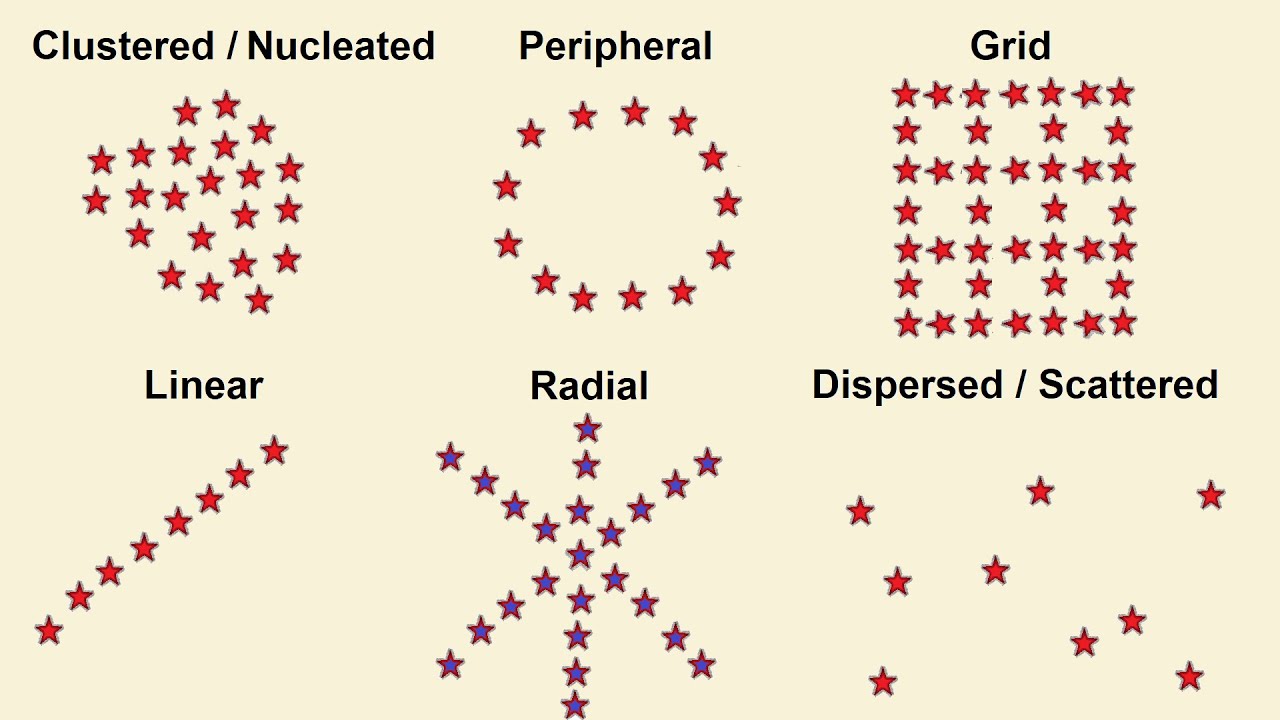
Your goal when reading a thematic map is to describe the distribution you see. For example, you might observe that "population density is clustered in coastal areas" or "rainfall shows a linear decrease from east to west."
2. A Crucial Step: Data Classification
How a map looks depends heavily on a decision made before any colors are even chosen: data classification. This is the process of grouping a range of data values into a smaller number of classes or categories. The method used can dramatically change the spatial pattern you see, so understanding this is key to being a critical map reader.
6.4: Constructing Thematic Maps
The GIS Commons textbook has an excellent, illustrated guide to the most common classification methods. Understanding these will help you see how the same data can tell different stories.
Please read section 6, "For choropleth and graduated-symbol maps, pick an appropriate classification method." It starts after rule 5. As you read, study the five maps of California's median age. Notice how each classification method (Equal Interval, Quantiles, Natural Breaks, etc.) creates a slightly different visual pattern, even though the underlying data is identical.
The key takeaway is that a cartographer's choice of classification method can either reveal or hide patterns. When you look at a thematic map, especially a choropleth map, always check the legend to see how the data has been broken into classes. Is it in equal intervals? Or are there very different ranges for each class? This context is vital for an accurate interpretation.
3. Choropleth Maps: Shading Areas
Choropleth maps are one of the most common types of thematic maps. They use shades or colors for predefined areas (like countries, states, or counties) to represent a statistical value.
Let's start with a quick visual introduction to choropleth maps from the Mr. Sinn YouTube channel.
Watch the segment from 01:27 to 02:10. He provides a clear definition and highlights the importance of scale in interpreting these maps.
The most important rule for choropleth maps is that they should display relative data—that is, rates, densities, or percentages (e.g., population density per square kilometer, or percentage of voters). They should not be used for absolute counts (e.g., total population). Why? Because our eyes are drawn to larger areas. A large state with a low population might look more significant on a choropleth map than a small, densely populated state if raw numbers are used.
Let's explore this critical point with a more detailed text. The 'Chapter 6 Thematic maps' PDF has a great section on choropleth maps that illustrates this potential for misinterpretation.
Please read subsection 6.3.2, "Choropleth maps." Pay close attention to Figure 6.9, which shows unemployment percentages. The author explains how this map can be misleading if you don't account for the actual population distribution.
When interpreting a choropleth map, always ask yourself:
- What data is being shown? Is it a rate or a raw number?
- How are the classes defined in the legend?
- What spatial pattern do I see? Is there a concentration of high values in one region? A north-south divide?
4. Proportional Symbol Maps: Sizing Symbols
So, if choropleth maps are for relative data, how do we map absolute data (raw totals or counts)? The answer is the proportional symbol map (also called a graduated symbol map). These maps use symbols—most often circles—that are scaled in size according to the value of the data at that location.
Let's return to the Mr. Sinn video for a quick look at graduated symbol maps.
Please watch from 03:01 to 03:26. This section explains how varying symbol sizes are used to represent data.
The great strength of proportional symbol maps is that they avoid the problem of area size influencing our perception. They show totals clearly and can be placed over a choropleth map to show both absolute and relative data simultaneously.
Now, let's read about proportional symbol maps in the same PDF from before. It directly contrasts this map type with the choropleth map we just studied, using the same unemployment data.
Read subsection 6.3.3, "Proportional symbol maps." Compare Figure 6.10 (absolute numbers of unemployed) with Figure 6.9 (unemployment percentage). This is a perfect example of how choosing the right map type is crucial for telling an accurate story.
Notice how the spatial story changes completely! The choropleth map made it seem like unemployment was a problem of the north and south, while the proportional symbol map reveals that the largest number of unemployed people were in the more populous western part of the country.
Test your understanding!
You are tasked with creating a thematic map of your country to show data on wheat production. You have two datasets for each province/state:
- The total number of tons of wheat harvested last year.
- The wheat yield (tons harvested per hectare of farmland).
Which map type—choropleth or proportional symbol—would be more appropriate for each dataset, and why?
Show answer
- For the total tons of wheat harvested (an absolute count), a proportional symbol map would be the best choice. A large circle in a province would clearly indicate a high total production, regardless of the province's size.
- For the wheat yield (a relative value, or rate), a choropleth map is appropriate. Shading each province based on its yield would effectively show the efficiency and productivity of farmland across the country, without being distorted by the raw size of the provinces or their total harvest.
5. Isoline Maps: Connecting Equal Values
Our final map type, the isoline map, works differently. Instead of showing data for predefined areas, it visualizes data that varies continuously across a surface, like temperature or elevation. An isoline is a line that connects points of equal value.
You are already familiar with one type of isoline: contour lines on a topographic map, which connect points of equal elevation. Other examples include:
- Isotherms: connect points of equal temperature.
- Isobars: connect points of equal atmospheric pressure.
- Isohyets: connect points of equal precipitation.

Y11-12 Geography: Contour Lines and Gradient
The Atomi channel has a fantastic, clear explanation of how to read contour lines. Since understanding terrain is fundamental to physical geography, this is a skill we'll focus on.
Please watch the first 3 minutes and 25 seconds of this video (from 00:01 to 03:25). It covers what contour lines are, how to determine the contour interval, and, most importantly, how to interpret the spacing of the lines to identify steep and gentle slopes.
The key interpretation skill for any isoline map is to look at the spacing of the lines:
- Closely spaced lines indicate a steep gradient, meaning the value is changing quickly (e.g., a steep hillside, a rapid drop in temperature).
- Widely spaced lines indicate a gentle gradient, meaning the value is changing slowly (e.g., a flat plain, a gradual change in pressure).
When you see an isoline map, try to visualize the "surface" it represents. Are you looking at hills and valleys? Pockets of high and low pressure? Areas of heavy and light rainfall?
Conclusion
Today we have deconstructed three of the most important types of thematic maps. By understanding how they are built and what kind of data they are best for, you can now interpret them more critically and accurately.
Key Takeaways:
- Choropleth maps use shading to show relative data (rates, densities, percentages) for predefined areas. Be wary of how the data is classified.
- Proportional symbol maps use scaled symbols to show absolute data (totals, counts) and are excellent for avoiding distortion caused by area size.
- Isoline maps use lines to connect points of equal value, visualizing continuous data like elevation, temperature, or pressure. The spacing of the lines indicates the steepness of the change.
- The goal of interpreting any of these maps is to identify and describe the spatial pattern of the theme.
Preview of the Next Lesson:
We have now learned how to design and interpret thematic maps. But how are these maps made in the modern era? In our next lesson, we will get our first introduction to the technology that powers modern cartography: Geographic Information Systems (GIS). We will answer the question, "What is a GIS?" by exploring its fundamental components and its powerful role in solving spatial problems.