Hello! Welcome to your next lesson on the fundamentals of Geographic Information Systems.
In our previous lesson, we established that a GIS is a powerful system built on five components: Hardware, Software, Data, People, and Methods. We highlighted that Data is the lifeblood of this system. We also had a brief preview of the two primary ways spatial data is structured.
Today, we will dive deep into this crucial topic. Our learning outcome is to differentiate between the vector and raster data models in GIS. Understanding how we represent the real world inside a computer is a foundational concept. It determines what kind of maps we can make, what types of analysis we can perform, and how we interpret the results. This is a cornerstone of modern mapping and GIS.
1. Modeling the Real World: Two Fundamental Approaches
At its heart, GIS is about creating a digital model of the real world. But the world is infinitely complex. To manage this complexity, we simplify reality using two main approaches:
- Representing the world as a collection of discrete, well-defined objects. (e.g., this specific building, that particular road, these individual trees).
- Representing the world as a continuous surface where a variable changes from one location to another. (e.g., elevation, temperature, land cover).
These two approaches correspond directly to the vector and raster data models.
Let's begin by reading a short introduction that defines these two models.
Spatial data models, vector data, and data quality
The document 'Spatial data models, vector data, and data quality' from Esri Press provides a formal introduction to how we represent real-world entities in GIS.
Please read the first three paragraphs of the document, starting from 'Spatial data models' and ending just before the heading 'Vector data model'. This will set the stage by explaining why we need data models in the first place.
Now, let's break down each model in detail.
2. The Vector Data Model: A World of Objects
The vector data model represents the world using discrete geometric shapes defined by coordinates. It's ideal for features that have clear boundaries.
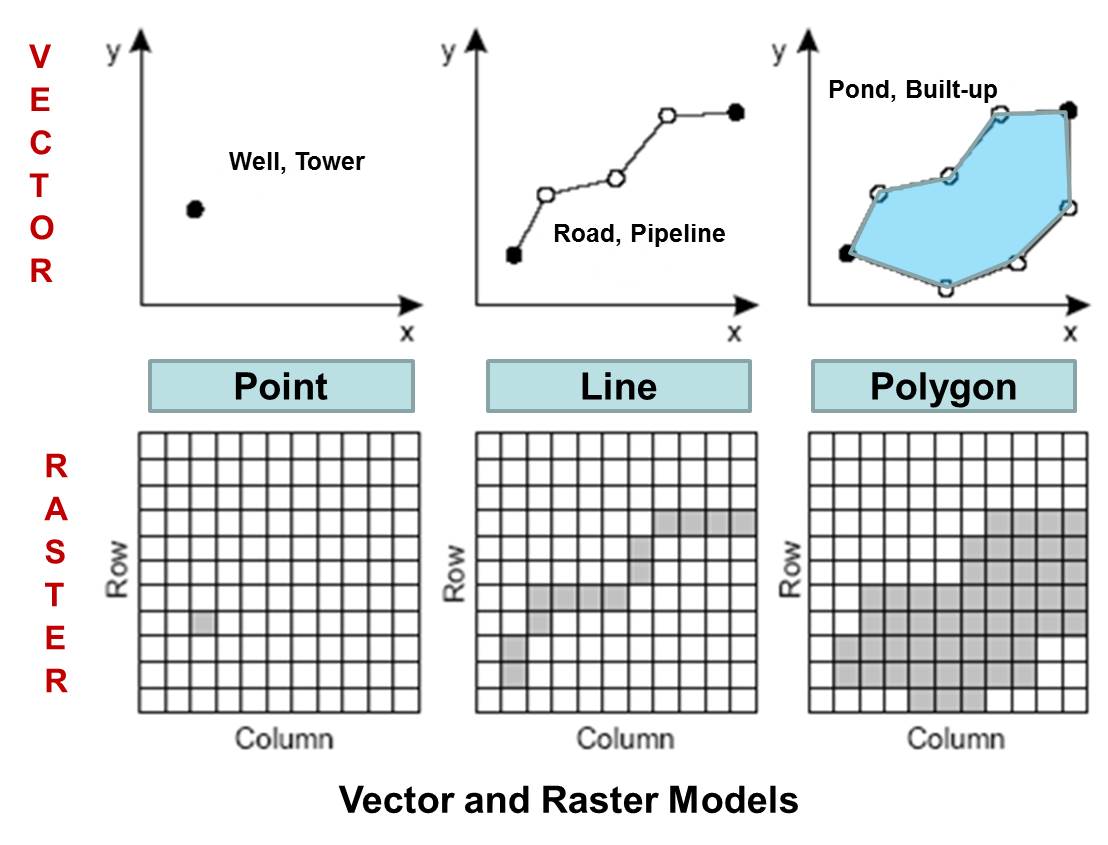
There are three types of vector features:
- Points: A single coordinate pair (x,y) representing a feature that is too small to be an area, like a well, a mountain peak, or the location of a historical event.
- Lines (or Polylines): A sequence of connected coordinates (called vertices) used to represent linear features like roads, rivers, or political boundaries.
- Polygons (or Areas): A closed set of connected lines, where the start and end points are the same. Polygons represent features with an area, such as a lake, a country, or a specific land parcel.
The following image provides a clear schematic of how these features are represented.
One of the key strengths of the vector model is that each feature can be linked to a rich set of descriptive information, known as attributes. For example, a point representing a city could have attributes for its name, population, and founding date. A line representing a river could have attributes for its name, length, and average flow rate.
To learn more about each vector type, let's turn to a helpful article.
Vector vs Raster in GIS: What's the Difference?
The article 'Vector vs Raster in GIS: What's the Difference?' from GISGeography.com gives clear, real-world examples for each vector type.
Read the section 'Vectors are points, lines, and polygons'. Focus on the examples given for each feature type (Points, Lines, Polygons) to solidify your understanding.
3. The Raster Data Model: A World of Surfaces
The raster data model takes a different approach. Instead of focusing on objects, it represents the world as a continuous surface, divided into a grid of equal-sized square cells, much like the pixels in a digital photograph.
Each cell in the grid holds a single numeric value representing the characteristic of that location.
- For a satellite image, each cell value might represent the intensity of reflected light.
- For an elevation model, each cell value represents the height above sea level.
- For a land cover map, each cell value is a code representing a category (e.g., 1=Forest, 2=Water, 3=Urban).
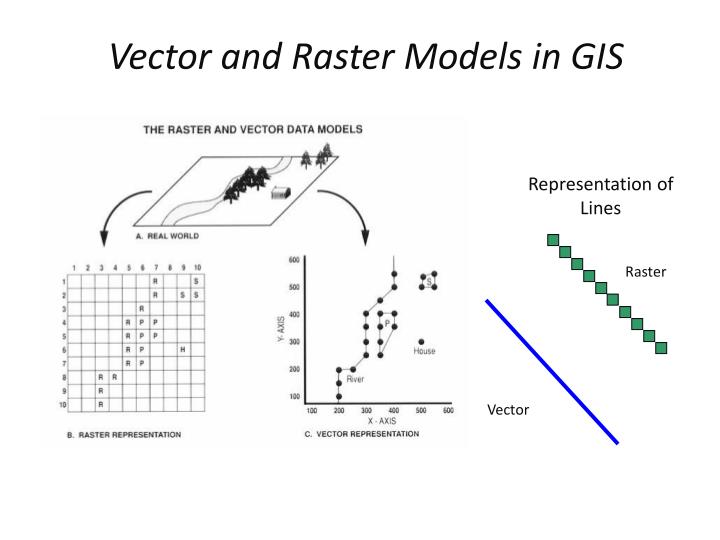
There are two main types of raster data:
- Continuous Rasters: Represent phenomena that change gradually across a surface, like temperature, elevation, or air pollution concentration. The cell values are typically floating-point numbers.
- Discrete (or Thematic) Rasters: Represent data in distinct categories, like land use types or soil classifications. The cell values are integers that correspond to a specific class.
A critical concept for raster data is spatial resolution, which is the size of the cell on the ground (e.g., 30 meters x 30 meters). A smaller cell size means higher resolution, more detail, and a larger file size. A larger cell size means lower resolution, less detail, and a smaller file size.
4. Comparing the Models: Strengths and Weaknesses
Neither model is inherently "better"; they are simply different tools for different jobs. The choice between vector and raster depends entirely on the nature of the data and the type of analysis you want to perform.
This next video provides an excellent and detailed comparison, using a simple real-world example to illustrate the differences. It also explains the trade-offs related to spatial resolution.
Raster data models and comparisons with vector
The video 'Raster data models and comparisons with vector' offers a direct comparison of how the two models represent the same real-world features and discusses their characteristics.
Please watch from 18:00 to 35:58. This long segment is the core of our lesson. The first part (18:00-23:10) visually compares the models. The second part (23:35-35:58) presents a comprehensive table-like summary of their advantages and disadvantages across several key characteristics. Pay close attention to this systematic breakdown.
Based on the video and our readings, let's summarize the key differences in a table for easy reference.
| Characteristic | Vector Model | Raster Model |
|---|---|---|
| Structure | Complex. Uses coordinates and topology to define objects. | Simple. A grid of cells (matrix). |
| Data Type | Represents discrete objects (points, lines, polygons). | Represents continuous surfaces or thematic categories. |
| Positional Accuracy | High. Defined by precise coordinates. | Limited by the cell size (resolution). Boundaries can appear jagged or "stair-stepped". |
| Attributes | Excellent. Can store many attributes for each feature. | Poor. Only one numeric value per cell. |
| Storage Size | Compact for discrete features. | Can be very large, especially for high-resolution data. |
| Analysis | Good for network analysis, proximity, and boundary-based queries. | Good for surface analysis, image processing, and mathematical modeling ("map algebra"). |
| Aesthetics | Excellent. Produces sharp, clean graphics that look like traditional maps. | Can appear pixelated. Quality depends on resolution. |
Test your understanding!
For each of the following scenarios, which data model—vector or raster—would be the more appropriate choice and why?
- Mapping the exact property lines for a new housing development.
- Analyzing a satellite image to identify areas of deforestation over time.
- Creating a model of temperature variations across a continent.
- Plotting the precise locations of all surveyed archaeological sites in a region.
- Representing the network of hiking trails in a national park.
Show answer
- Vector (Polygon): Property lines are legally-defined, discrete boundaries that require high positional accuracy. Polygons are perfect for representing these parcels.
- Raster: Satellite imagery is inherently raster data. Analyzing changes in land cover (like forest vs. non-forest) is a classic raster analysis task.
- Raster: Temperature is a continuous phenomenon that varies gradually across space, making it a perfect fit for a continuous raster surface.
- Vector (Point): Each archaeological site is a discrete location defined by a precise coordinate. The point vector type is ideal for this.
- Vector (Line): Hiking trails are linear features. A line vector model can accurately represent their paths and can be used for network analysis (e.g., finding the shortest route between two points).
Conclusion
Today, you've learned about the two fundamental ways we model our world in a GIS. This is a critical concept that underpins all the practical work you will do later on.
Key Takeaways:
- The vector data model represents the world as a collection of discrete objects with precise boundaries, using points, lines, and polygons. It is excellent for features like roads, buildings, and political borders and allows for rich attribute data.
- The raster data model represents the world as a continuous grid of cells (pixels), where each cell has a single value. It is ideal for representing surfaces like elevation and temperature, or for working with imagery.
- The choice between vector and raster is not about which is "better," but which is more appropriate for the specific data and analytical task. Vector is for objects; raster is for surfaces.
Preview of the Next Lesson:
Now that we understand how geographic data is structured into vector and raster models, a logical next question is: where does this data come from? In our next lesson, we will begin to answer that by exploring the principles of GPS and remote sensing for spatial data acquisition. You will see how GPS is a primary tool for capturing precise vector data and how remote sensing (from satellites and aircraft) is the main source of the raster data we've just discussed.