Hello! Welcome to the sixth and final lesson of our module on Financial Accounting for Lawyers.
In our previous lessons, we've built a solid foundation by understanding the three core financial statements—the Balance Sheet, Income Statement, and Statement of Cash Flows—and the accounting methods that produce them. You now know that profit is not the same as cash, and that these statements are the official narrative of a company's financial story.
Today, we'll learn how to become critical readers of that story. Our learning outcome is to interpret key financial ratios (liquidity, leverage, profitability) to assess company performance. Financial ratios are powerful diagnostic tools that transform the raw numbers from financial statements into meaningful insights. For a corporate lawyer, this skill is not optional. It is essential for conducting due diligence in mergers, negotiating loan agreements, assessing a client's solvency, or evaluating a litigation opponent's financial strength.
Let's begin by understanding why we use ratios in the first place.
1. Why Ratios? The Power of Standardization
Comparing the absolute financial numbers of two companies can be misleading. A large company like Apple will naturally have higher dollar-value profits than a small startup. Does that automatically make it "better" or more efficient? Not necessarily. Ratios solve this problem by standardizing financial information, allowing for meaningful comparisons.
To understand the core theory behind this, let's hear from Professor Aswath Damodaran, a leading expert in corporate finance.
This short clip from Professor Damodaran explains the fundamental reason for using ratios: to standardize numbers for comparison across companies and over time.
Please watch the first minute of the video (00:00 - 01:01). Focus on his explanation of why comparing absolute numbers is like 'comparing apples to oranges' and how ratios provide a solution.
As Professor Damodaran notes, ratios allow us to compare a company against three key benchmarks:
- Its own past performance (Trend Analysis): Is the company improving or declining over time?
- Its competitors (Cross-Sectional Analysis): How does the company stack up against others in the same industry?
- The industry average (Industry Analysis): Is the company performing above or below the norm for its sector?
This context is what turns a simple number into a powerful piece of evidence about a company's health.
2. The Three Key Categories of Ratios
We will focus on three critical categories of ratios that answer fundamental questions about a company's performance.
- Liquidity Ratios: Answer the question, "Can the company pay its short-term bills?" They measure a company's ability to meet its obligations due within the next year.
- Leverage (Debt) Ratios: Answer the question, "How much financial risk is the company taking on?" They measure the extent to which a company is using debt to finance its assets.
- Profitability Ratios: Answer the question, "How effectively is the company generating profit?" They measure the company's ability to turn sales and investment into earnings.
Let's dive into each of these categories.
3. Liquidity Ratios: Assessing Short-Term Solvency
A company that cannot pay its immediate bills—like payroll, suppliers, and rent—is in serious trouble, regardless of how profitable it appears on paper. Liquidity ratios are the first-line test for this kind of short-term financial distress.
The following video provides a clear introduction to the two most common liquidity ratios.
Financial Ratio Analysis【Dr. Deric】
This segment from Dr. Deric's 'Financial Ratio Analysis' video will walk you through the calculation and interpretation of the Current Ratio and the Quick Ratio.
Watch from 03:06 to 05:03. Pay attention to the formulas for the Current Ratio and the Quick (Acid-Test) Ratio, and especially why the Quick Ratio is considered a more 'stringent' or conservative measure.
To summarize the key formulas:
-
Current Ratio =
- This ratio gives a broad look at whether a company has enough current assets (cash, receivables, inventory) to cover its current liabilities. A ratio above 1.0 is generally desired, but what's "good" varies by industry.
-
Quick Ratio (or Acid-Test Ratio) =
- This is a stricter test because inventory can sometimes be difficult to sell quickly without a steep discount. By excluding it, the quick ratio measures a company's ability to pay its bills using only its most liquid assets.
As a lawyer, you might see these ratios referenced in loan agreements, where a borrower must maintain a certain current ratio to avoid defaulting on the loan.
Test your understanding!
A company has the following on its balance sheet:
- Cash: $50,000
- Accounts Receivable: $100,000
- Inventory: $150,000
- Accounts Payable: $120,000
- Short-term Loans: $80,000
Calculate its Current Ratio and Quick Ratio. What do these ratios suggest about the company's liquidity?
Show answer
-
Current Assets = $50,000 (Cash) + $100,000 (AR) + $150,000 (Inventory) = $300,000
-
Current Liabilities = $120,000 (AP) + $80,000 (Loans) = $200,000
-
Current Ratio = = 1.5
-
Quick Ratio = = = 0.75
The Current Ratio of 1.5 suggests the company is in a decent position to cover its short-term debts. However, the Quick Ratio of 0.75 reveals a potential weakness. Without relying on selling its inventory, the company does not have enough liquid assets to cover its current liabilities. This indicates a heavy dependence on inventory sales for its short-term survival.
4. Leverage Ratios: Gauging Financial Risk
Leverage refers to using borrowed money (debt) to finance assets. While debt can amplify returns for shareholders, it also increases risk. If a company's business declines, it still must make its interest and principal payments to lenders, or risk bankruptcy. Leverage ratios help us quantify this risk.
Financial Ratio Analysis【Dr. Deric】
Let's return to Dr. Deric's video to understand the key leverage ratios.
Watch from 13:07 to 15:54. Focus on the Debt-to-Equity Ratio, the Debt Ratio (often called Debt-to-Assets), and the Times Interest Earned Ratio. Notice who is most interested in these ratios (creditors and bondholders) and why.
Here are the key leverage ratios:
-
Debt-to-Equity Ratio =
- This compares the amount of capital supplied by creditors to the amount supplied by owners. A high ratio indicates a high degree of leverage and greater risk for shareholders and creditors.
-
Debt-to-Assets Ratio =
- This ratio shows what percentage of a company's assets are financed through debt. A ratio of 0.6 means that 60% of the company's assets are funded by creditors.
-
Times Interest Earned (TIE) Ratio =
- Where EBIT is Earnings Before Interest and Taxes. This is a coverage ratio. It measures how many times a company's operating profit can cover its required interest payments. A TIE ratio below 1.0 is an extreme red flag, meaning the company isn't even generating enough operating profit to pay its lenders.
For a corporate lawyer, these ratios are paramount. Loan agreements contain covenants that often require the borrowing company to keep its Debt-to-Equity ratio below a certain level or its TIE ratio above a certain level. A breach of these covenants can trigger a default, giving the lender the right to demand immediate repayment of the entire loan.
5. Profitability Ratios: Measuring Performance
Ultimately, a company needs to make money to succeed. Profitability ratios measure how well a company generates profits from its sales and its assets. There are two main types: margins and returns.
Profit Margins
Margins measure how much profit the company keeps from each dollar of sales.
Returns
Returns measure how effectively the company uses its assets and its owners' investments to generate profit.
Professor Damodaran provides an excellent conceptual breakdown of the different profit margins and what each one tells you about a company's operations and life cycle. He also explains the crucial concepts of Return on Equity (ROE) and Return on Invested Capital (ROIC).
Watch from 01:01 to 11:40. This is a longer segment, but it's rich with the 'why' behind the numbers. In the first part (01:01-07:08), focus on the difference between Gross Margin, Operating Margin, and Net Margin. In the second part (07:08-11:40), concentrate on his explanation of Return on Equity (ROE) and why it measures returns to shareholders.
Here is a summary of the core profitability ratios discussed.
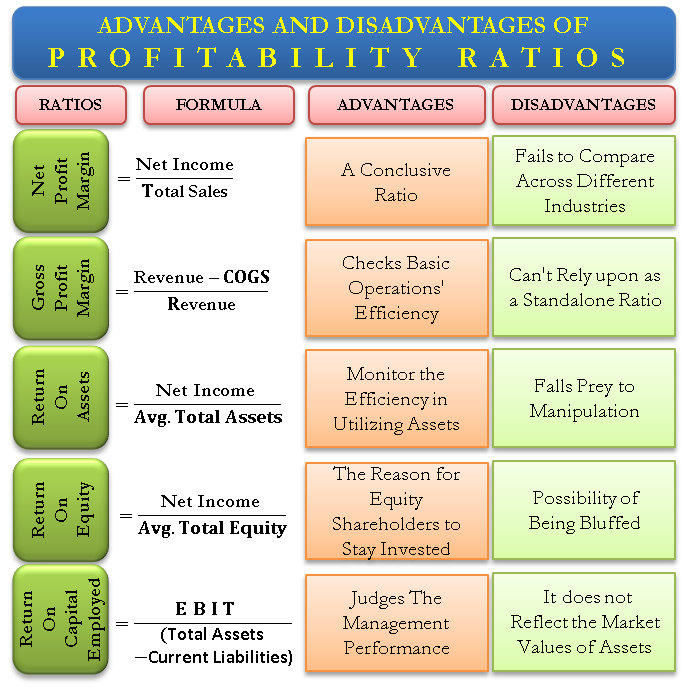
Let's recap the most important ones:
-
Gross Profit Margin =
- Measures the profitability of the core product or service before any overhead, marketing, or administrative costs.
-
Operating Profit Margin =
- Measures the profitability of the company's core business operations before the effects of interest and taxes.
-
Net Profit Margin =
- The "bottom line" margin. It shows the percentage of each sales dollar that is left over after all expenses, including interest and taxes, have been paid.
-
Return on Assets (ROA) =
- Measures how efficiently a company is using its assets to generate profit.
-
Return on Equity (ROE) =
- This is a key metric for investors. It measures how much profit the company generates for each dollar of equity invested by its owners.
Test your understanding!
A company's income statement shows:
- Revenue: $1,000,000
- Cost of Goods Sold (COGS): $600,000
- Operating Expenses: $250,000
- Interest & Taxes: $50,000
Its balance sheet shows Total Assets of $800,000 and Shareholders' Equity of $500,000.
Calculate the company's Gross Margin, Net Margin, and Return on Equity (ROE).
Show answer
First, let's find Gross Profit and Net Income:
- Gross Profit = Revenue - COGS = $1,000,000 - $600,000 = $400,000
- Net Income = Gross Profit - Operating Expenses - Interest & Taxes = $400,000 - $250,000 - $50,000 = $100,000
Now, calculate the ratios:
- Gross Profit Margin = = 40%
- Net Profit Margin = = 10%
- Return on Equity (ROE) = = 20%
6. A Lawyer's Perspective: Context and Limitations
A ratio is just a number. Its power comes from interpretation, and its danger comes from misinterpretation. As a future lawyer, you must maintain a healthy skepticism and always consider the context.
Financial Ratios: In-Depth Explanation with Examples
The website AccountingCoach provides a detailed breakdown of financial ratios. We will focus on its discussion of the benefits and, more importantly, the limitations of this type of analysis.
Please read the section titled 'Benefits and Limitations of Financial Ratios'. Pay close attention to the limitations, such as differences in accounting policies (like LIFO vs. FIFO, which we've touched on before), the focus on historical data, and the fact that valuable intangible assets don't appear on the balance sheet.
Key limitations to always keep in mind:
- Industry Differences: A 70% debt-to-assets ratio might be normal for a capital-intensive utility company but terrifying for a software company.
- Accounting Methods: Different companies may use different (but still legal) accounting practices, making direct comparisons difficult.
- One-Time Events: A large sale of an asset or a major lawsuit settlement can distort ratios for a single period.
- They are a Starting Point: Ratios don't give you the answer; they tell you which questions to ask. A low quick ratio prompts the question, "Why is there so much inventory, and is it sellable?" A declining profit margin prompts, "Are costs rising or is the company facing pricing pressure?"
Conclusion
In this lesson, we have armed you with the essential tools to analyze a company's financial health. You are no longer just a passive reader of financial statements but an active interpreter.
Key Takeaways:
- Three Core Questions: Financial ratios help answer three critical questions: Can the company pay its bills (liquidity)? How much risk is it taking (leverage)? And how good is it at making money (profitability)?
- Key Liquidity Ratios: The Current Ratio provides a broad measure of short-term solvency, while the Quick Ratio offers a more conservative view by excluding inventory.
- Key Leverage Ratios: The Debt-to-Equity and Debt-to-Assets ratios measure the degree of debt financing, while the Times Interest Earned ratio assesses the company's ability to cover its interest payments.
- Key Profitability Ratios: Margins (Gross, Operating, Net) measure profit relative to sales, while Returns (ROA, ROE) measure profit relative to investment.
- Context is King: Ratios are meaningless without context. They must be compared against industry benchmarks, historical trends, and competitors, and their limitations must always be acknowledged.
This lesson concludes our module on Financial Accounting. You have progressed from the basic accounting equation to interpreting sophisticated financial ratios—a crucial skill set for your future in corporate law.
In our next module, we will shift from accounting to law, starting with a foundational topic: Revenue Recognition Principles, a subject where accounting rules and contractual law intersect with significant consequences.