Hello again. In our last lesson, we built a detailed framework for reviewing individual calls—your "game tape." That micro-level analysis is essential for honing your technique on a call-by-call basis. Now, we're going to zoom out and look at the bigger picture.
Exceptional performance isn't just about winning one conversation; it's about building a system that consistently produces wins over time. To do that, you need to move from analyzing single plays to understanding the entire season. This means looking at the data from all your calls to spot trends, identify what's working, and pinpoint where your process can be improved.
Today, our learning outcome is to analyze logged call outcomes in Notion to identify patterns in successful versus unsuccessful interactions. We'll define the essential metrics—or Key Performance Indicators (KPIs)—you should be tracking and then use Notion's powerful features to turn your raw call logs into strategic insights. This will transform your Notion workspace from a simple tracking tool into a powerful analytics dashboard for your phone-setting business.
From Data Points to Data Insights: What to Measure
Before you can analyze your performance, you need to define what "performance" means in measurable terms. In the world of sales and appointment setting, these measures are called Key Performance Indicators (KPIs). A KPI is simply a quantifiable measure used to evaluate the success of a particular activity. Given your math background, you'll be comfortable working with the rates and percentages we'll use to define these metrics.
The article "Appointment Setting KPIs" provides a comprehensive list of metrics. We'll focus on the few that are most critical for your role as a phone setter converting warm leads.
Appointment Setting KPIs: 19 Metrics Every B2B Company ...
This article from Leads at Scale is a great primer on the metrics that matter in appointment setting. We'll select a few key ones to build our dashboard around.
Please read the following sections to understand the core KPIs we will track: Read the section on "Call-to-Appointment Rate." For your purposes, think of this as the "Call-to-Booking Rate"—the percentage of your initial phone calls that result in a booked sales meeting. Focus on the subsections Why it Matters and how to calculate it. Next, read the section on "Appointment Show Rate." This is crucial for measuring the quality of the appointments you set. Read the part explaining its relevance. Then, read section 14 on the "No-Show Rate." This is the inverse of the show rate but equally important for identifying inefficiencies. Pay attention to the discussion on what high rates indicate. Also read section 19 on the "Appointment Cancellation Rate," and understand how it differs from a no-show. Finally, review the summary section titled "How to Use KPI Data to Improve Results" to see actionable advice for several of these metrics.
To summarize, we will focus on these key questions:
- Call-to-Booking Rate: How effective am I at turning a phone conversation into a scheduled meeting?
- Show Rate: Are the meetings I book actually happening?
- No-Show & Cancellation Rates: Why are booked meetings failing to happen?
Answering these questions with data is the first step toward systematic improvement.
Upgrading Your Notion CRM for Analysis
Your current Notion setup is great for tracking individual leads. Now, let's ensure it's structured to allow for the aggregate analysis we just discussed. This involves adding specific properties to your main lead tracking database.
Your Action Step:
Go to your main "Sales CRM" or lead tracking database in Notion (not the Call Review Hub we made last time). We need to ensure you have the right properties to track our KPIs. Add or refine the following Select properties:
Lead Status: This tracks the prospect's overall journey. You might already have this. Ensure it includes stages like:New,Contacted,Meeting Booked,Closed-Won,Closed-Lost.Call Outcome: This property tracks the result of a specific call. Create aSelectproperty with options like:Booked Meeting,Follow-up Sent,Voicemail Left,Wrong Number,Not Interested.Meeting Status: This tracks the fate of a booked meeting. Create aSelectproperty with options:Scheduled,Completed,No-Show,Canceled.Lead Source: This is critical for pattern analysis. Create aSelectproperty with options that reflect where your leads come from, for example:Inbound DM,Outbound DM,Referral,Past Client.
Having this structured data is the foundation for everything that follows.
Finding the Story in Your Data
With your data structured correctly, you can now use Notion's built-in tools to ask questions and find answers. The primary tools for this are Filters, Groups, and Charts.
Using Filters and Groups to Segment Your Data
Filters allow you to see only the data that meets specific criteria, while Groups allow you to categorize your data based on a property.
- A Filter question: "Show me all the leads I need to follow up with." (Filter where
Lead StatusisContactedandLast Contactedis more than 3 days ago). - A Group question: "How many of my calls resulted in a booked meeting versus a 'not interested' outcome?" (Group your database by the
Call Outcomeproperty).

This is the most basic form of analysis, but it's incredibly powerful for quickly understanding the state of your pipeline.
Visualizing Patterns with Notion Charts
While tables and lists are useful, charts make patterns immediately obvious. Notion's charting capabilities can turn your database into a dynamic dashboard.
This video from Jordan Ross provides a brilliant, step-by-step guide to creating KPI charts directly within Notion. It shows exactly how to translate the data you're logging into visual insights.
How Top Entrepreneurs Track KPIs Using Notion
This video is a practical tutorial on building a KPI dashboard in Notion, which is exactly our goal for this lesson.
Please watch the following clips to see how it's done: First, watch the segment on creating a basic line chart to track the number of calls booked per week. This shows how to visualize volume over time. Calls per week. Next, see how to track rates, like your close rate, as a percentage. This is key for our KPIs. Tracking rates. Finally, and most importantly, watch the section on analyzing success by lead source. This is a perfect example of identifying a powerful pattern. Success by source.
As you saw in the video, visualizing your close rate by lead source can reveal powerful truths. You might find that while you get more leads from one source, another source produces leads that are far more likely to convert. This is an actionable insight: you can now focus more of your energy on the higher-quality source.
To see what a fully developed sales dashboard can look like, this next video by Austin Schneider demonstrates a comprehensive "Sales OS" built in Notion. Pay attention to how he moves from logging data on a single call to viewing the aggregate data on his dashboard.
How I Turned Notion into a CRM For My Agency (10X SALES)
This video showcases a complete sales system in Notion, connecting the dots between logging individual call data and analyzing high-level metrics.
Watch how data from an individual call is captured from the sales call entry. Then, see how all this data rolls up into a dashboard that visualizes key metrics like show rate and close rate from the sales data view. This demonstrates the full cycle from data entry to analysis.
Your Turn: Build Your Analytics Dashboard
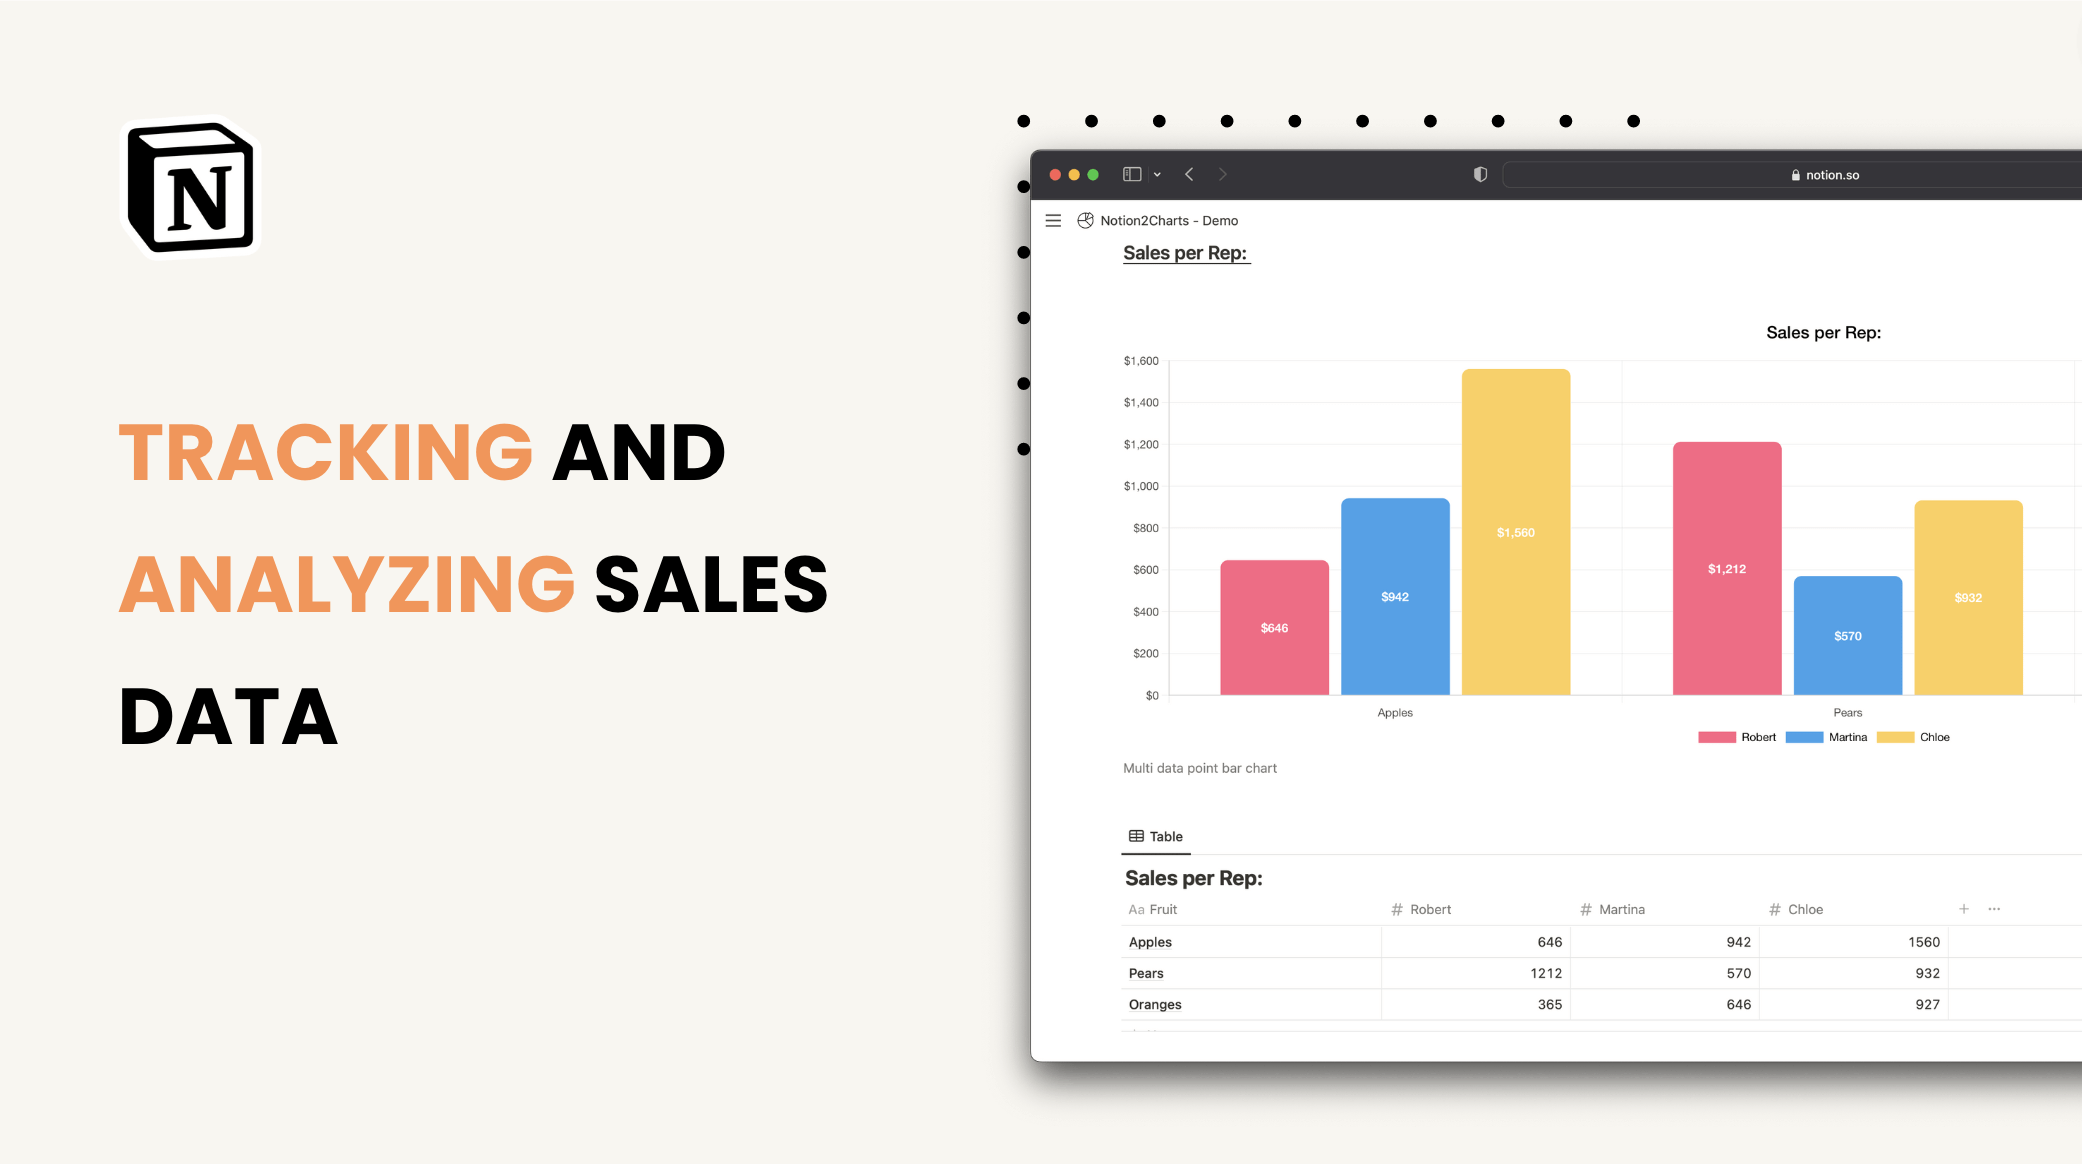
Let's apply these concepts. Create a new page in Notion called "My Sales Dashboard." On this page, you will use Notion's /chart command to visualize the data from your lead tracking database.
Create two charts:
-
Call Outcome Breakdown:
- Choose a Bar Chart or Pie Chart.
- Select your lead tracking database as the source.
- Group the chart by your
Call Outcomeproperty. - This will give you an instant visual of how many of your calls are successful, require follow-up, or are unsuccessful.
-
Bookings by Lead Source:
- Choose a Bar Chart.
- Select your lead tracking database as the source.
- Add a Filter where
Call OutcomeisBooked Meeting. - Group the chart by your
Lead Sourceproperty. - This chart answers the critical question: "Where are my best appointments coming from?"
Conclusion
Congratulations, you have now completed the full system for mastering phone setting. You've journeyed from the psychology of the call (Module 1) and its structure (Module 2), through handling objections (Module 3) and even touching on cold calling (Module 4). In this final module, you have built a complete, professional system for continuous improvement.
You learned to review your calls like a pro with a detailed scorecard, and today, you've learned to zoom out and analyze the strategic patterns in your performance. This feedback loop—from making calls, to logging outcomes, to deep-dive reviews, to high-level analysis—is the engine of your growth.
Key Takeaways:
- Data Beats Guesswork: Relying on KPIs like Call-to-Booking Rate and Show Rate provides an objective measure of your performance.
- Structure is Everything: Your Notion database must be structured with the right properties (
Call Outcome,Meeting Status,Lead Source) to enable analysis. - Visualize for Insight: Use Notion's filters, groups, and charts to turn rows of data into actionable stories that reveal what's working and what isn't.
- Ask the Right Questions: Use your dashboard to answer critical questions like, "Where do my best leads come from?" and "Why are my booked appointments not showing up?"
This is the last lesson in our course. You now possess the skills, frameworks, and systems not just to be a phone setter, but to be a data-driven professional who is in complete control of their own development. Continue to use the Notion systems we've built, keep reviewing your "game tape," and never stop analyzing the data. This is the path to mastery. Best of luck.