Hello. This first module examines how district boundaries turn votes into seats. Before studying how a map can favor a party, you need a reliable way to read election results: identify the winner in each district, then count the seats. In this lesson, you will do that for two-party and three-party elections and see why the party with the most votes across all districts need not win the most seats.
Allow about 35–40 minutes, including time to inspect the vote tables and follow the calculations.
The rule applies district by district
In a single-member district, voters elect one representative. Under plurality voting, the candidate with more votes than any other individual candidate wins that district’s one seat. A candidate does not necessarily need more than half the votes.
Plurality and Majority Electoral Systems
Watch “Plurality and Majority Electoral Systems” from The Citizen Genius Project for a concise statement of the plurality rule.
Watch the plurality example. Focus on why the candidate with 35 votes wins against candidates with 30, 25, and 10 votes, despite receiving fewer than half the ballots.
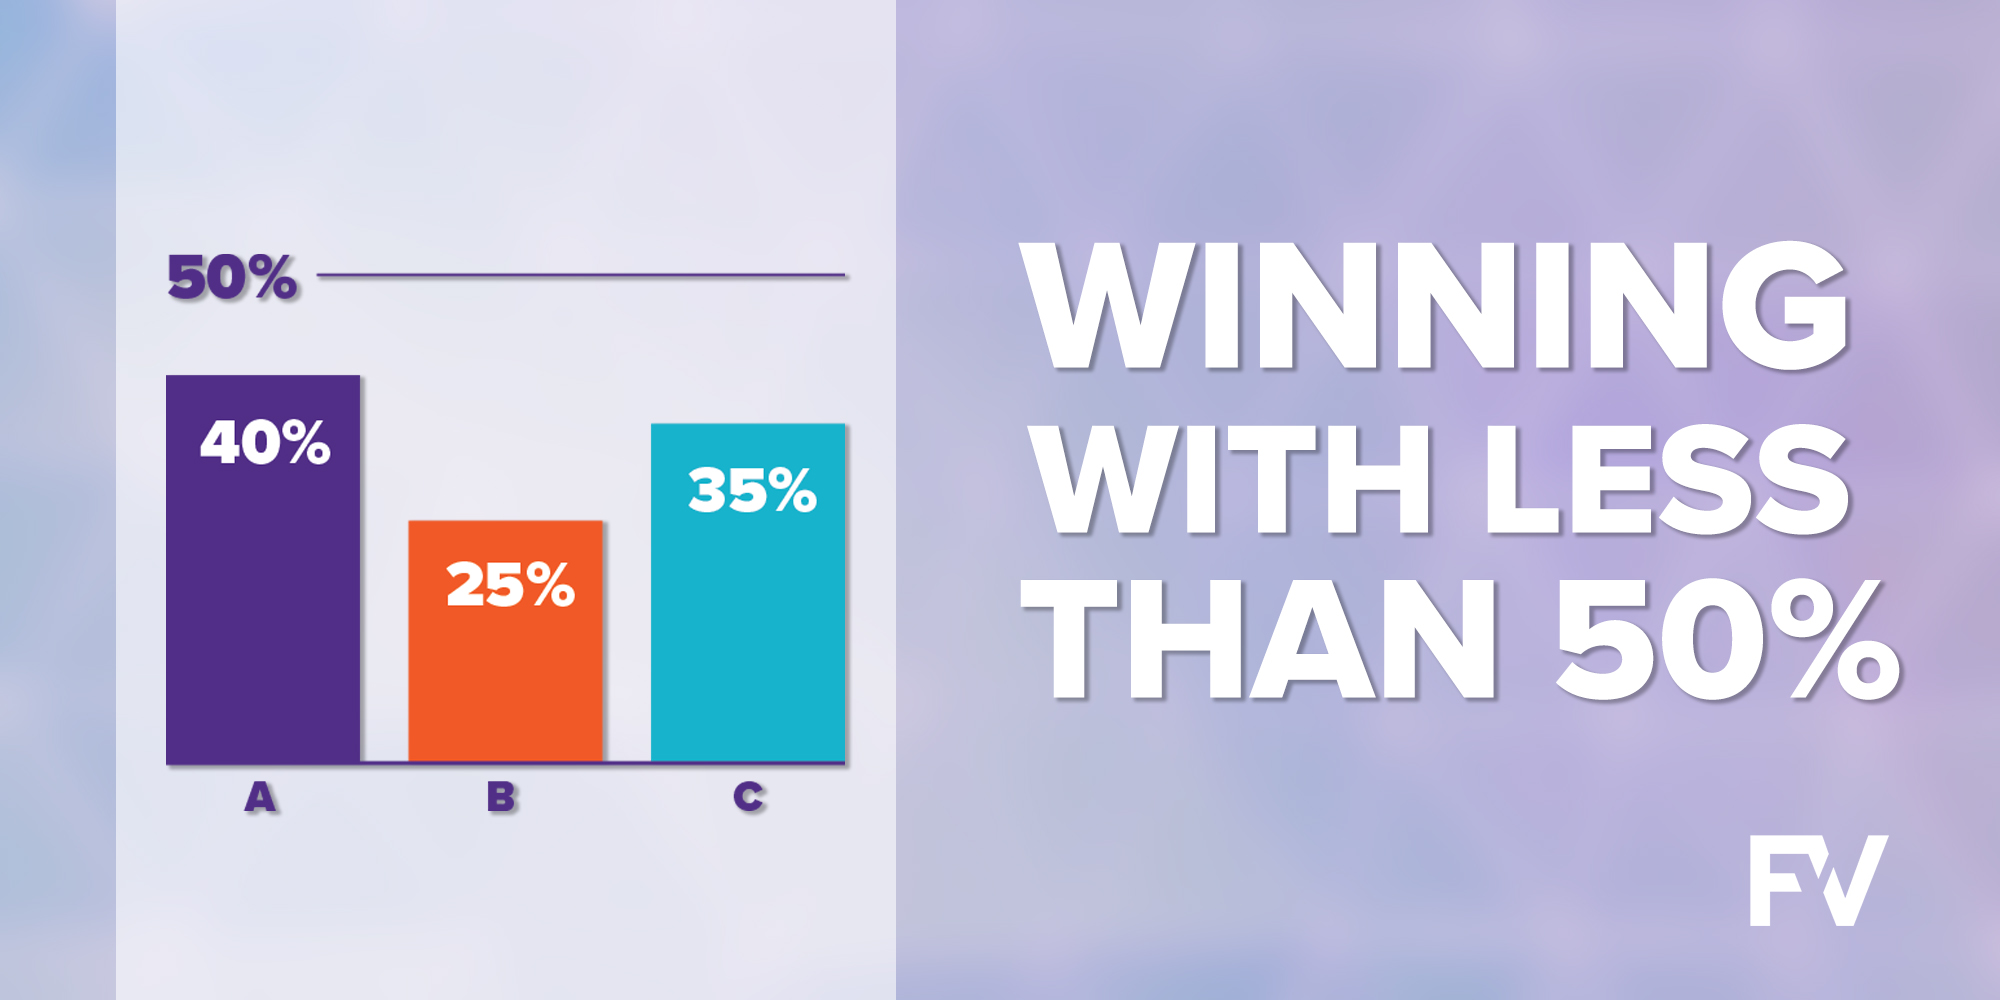
The distinction matters whenever more than two candidates run. In the chart below, A receives 40% of the votes, C receives 35%, and B receives 25%. A wins the seat because 40% is the largest individual share. The other 60% is split between two candidates; plurality voting does not combine their votes.
That result describes one district. To determine a party’s representation across several districts, apply the same rule separately in each district. Each winning candidate adds exactly one seat to their party’s total.
Counting seats without confusing them with votes
Consider five districts, each with 100 votes cast, and one candidate from each of two parties in every district.
| District | Party A votes | Party B votes | Seat won by |
|---|---|---|---|
| 1 | 51 | 49 | A |
| 2 | 51 | 49 | A |
| 3 | 51 | 49 | A |
| 4 | 20 | 80 | B |
| 5 | 20 | 80 | B |
| Total | 193 | 307 | A: 3; B: 2 |
The calculation has two distinct parts. First, compare the votes within each row: A wins Districts 1–3, while B wins Districts 4–5. Then count the winning rows: three seats for A and two for B.
Adding votes down the columns answers a different question. Across all five districts, B receives 307 of the 500 votes, or 61.4%, yet wins only two of the five seats, or 40%. A receives 38.6% of votes but wins 60% of seats. These numbers are consistent because the election awards seats for district victories, not for statewide vote totals. A wins three close races; B wins two races by large margins. Once a candidate wins a district, a larger margin does not earn a second seat there.
This table assumes equal turnout to keep the arithmetic transparent. Equal district populations, as required in many real redistricting settings, do not by themselves guarantee equal numbers of votes cast. For the seat calculation, however, the rule is unchanged: compare candidate totals within each district, regardless of turnout elsewhere.
Holding total votes steady while seat counts change
The next reading provides a sharper comparison. Its two hypothetical elections have the same total votes for each party, and even the same total ballots cast in each corresponding district. What changes is how each party’s votes are distributed among districts.
Read “Single Member Plurality” on the Simon Fraser University course page for its paired four-district election tables.
Under “Single Member Plurality (SMP),” read the opening explanation. Then find the tables headed “Election #1” and “Election #2.” In each, read the district vote totals from the Carrots row through the Cabbage row; the first table begins with Carrots receiving 7,000 votes in its first district, while the second table includes Spinach receiving 9,000 in its second district. Use the marked winners to check which party earns each of the four seats. The summary below Election #1 has blank cells, so rely on the district totals rather than treating those blanks as results.
Here is the district-by-district count from the reading:
| District | Election #1: highest vote total | Election #2: highest vote total |
|---|---|---|
| First | Carrots, 7,000 | Spinach, 7,000 |
| Second | Spinach, 10,000 | Spinach, 9,000 |
| Third | Carrots, 6,000 | Spinach, 8,000 |
| Fourth | Carrots, 8,000 | Cabbage, 8,000 |
In Election #1, Carrots wins three districts, Spinach wins one, and Cabbage wins none. In Election #2, Spinach wins three, Cabbage wins one, and Carrots wins none.
Yet adding the party votes across all four districts gives the same totals in both elections: Carrots has 26,000, Spinach has 27,000, and Cabbage has 11,000. Spinach has the most votes overall in both elections, but its seat count changes from one to three. Carrots’ seat count changes from three to zero without changing its overall vote total.
Notice how to audit an individual result rather than trusting the winner marks. In the third district of Election #1, Carrots has 6,000 votes, Cabbage 5,000, and Spinach 4,000. Carrots therefore wins that district’s one seat. In the corresponding district of Election #2, Spinach’s 8,000 exceeds Carrots’ 6,000 and Cabbage’s 1,000, so Spinach wins it instead. Repeat that comparison for each district, and the seat totals follow.
The examples establish what geographic distribution can do to representation. They do not, on their own, establish why votes are distributed that way or whether anyone deliberately drew boundaries to obtain a particular result. Those are separate questions for later lessons.
What to do with an apparent edge case
The plurality rule identifies a winner when one candidate has a unique highest vote total. If two candidates tie for the highest total, do not award the seat to whichever party appears first in a table. A tie requires the jurisdiction’s applicable tie-breaking procedure; without that information, the winner—and therefore the final seat count—is unresolved.
For ordinary, untied district results, the method stays simple:
- Compare candidate vote totals within each district and identify the highest.
- Give that district’s one seat to the winning candidate’s party.
- Count seats across districts. Keep that count separate from any calculation of overall vote totals or vote shares.
Key takeaways
Under single-member plurality elections, districts award seats; aggregate votes do not. A candidate can win a district with less than 50% when the opposition is divided among multiple candidates, and a party can win more seats than another party that received more votes overall. The decisive information is the location of each party’s votes across districts.
The next lesson uses that counting method on a small voter map to examine packing: concentrating opposing voters in particular districts while keeping the electorate and its preferences fixed.