Hello. The previous lesson showed that proportionality, partisan symmetry, and competitiveness can give different verdicts on the same election. This lesson adds a fourth measure: the efficiency gap. You will calculate it from district results, then examine why turnout and the choice of fairness benchmark matter when interpreting the number.
What counts as a wasted vote
In a single-member district, a party can win by one vote or by a landslide, but it receives one seat either way. The efficiency gap builds on that observation. It calls two kinds of votes wasted: all votes for a losing candidate, and a winner’s votes beyond the threshold used to secure victory. “Wasted” is a technical label for this calculation; it does not mean a voter’s ballot was pointless.
The Math Behind Gerrymandering and Wasted Votes | Quanta Magazine
Read Quanta Magazine’s explanation for the two kinds of wasted votes and its first four-district calculation. It connects the arithmetic to the packing and cracking you encountered earlier in the course.
Begin in the portion that opens “So what counts as a wasted vote?” Read the explanation and example, stopping after the paragraph about packing and cracking, before the ten-district examples. Pay particular attention to which votes the article counts in a district a party wins.
The word threshold needs care in a small example. With 50 votes cast for two candidates, a 25–25 split is a tie; 26 votes are needed for an outright win. The Quanta calculation instead uses 25, or exactly 50%, as a simplifying threshold. Both conventions appear in discussions of the efficiency gap. We will label which one we use rather than mix their results.
First, total each party’s wasted votes across all districts. Then divide their difference by all votes cast, not by the number of districts or by one party’s votes:
The absolute value reports the size of the gap. To report its direction, name the party with fewer wasted votes as the party the gap favors.
A four-district calculation
The image below provides an election with 50 votes in each of four districts. Purple wins the first three; Olive wins the fourth.
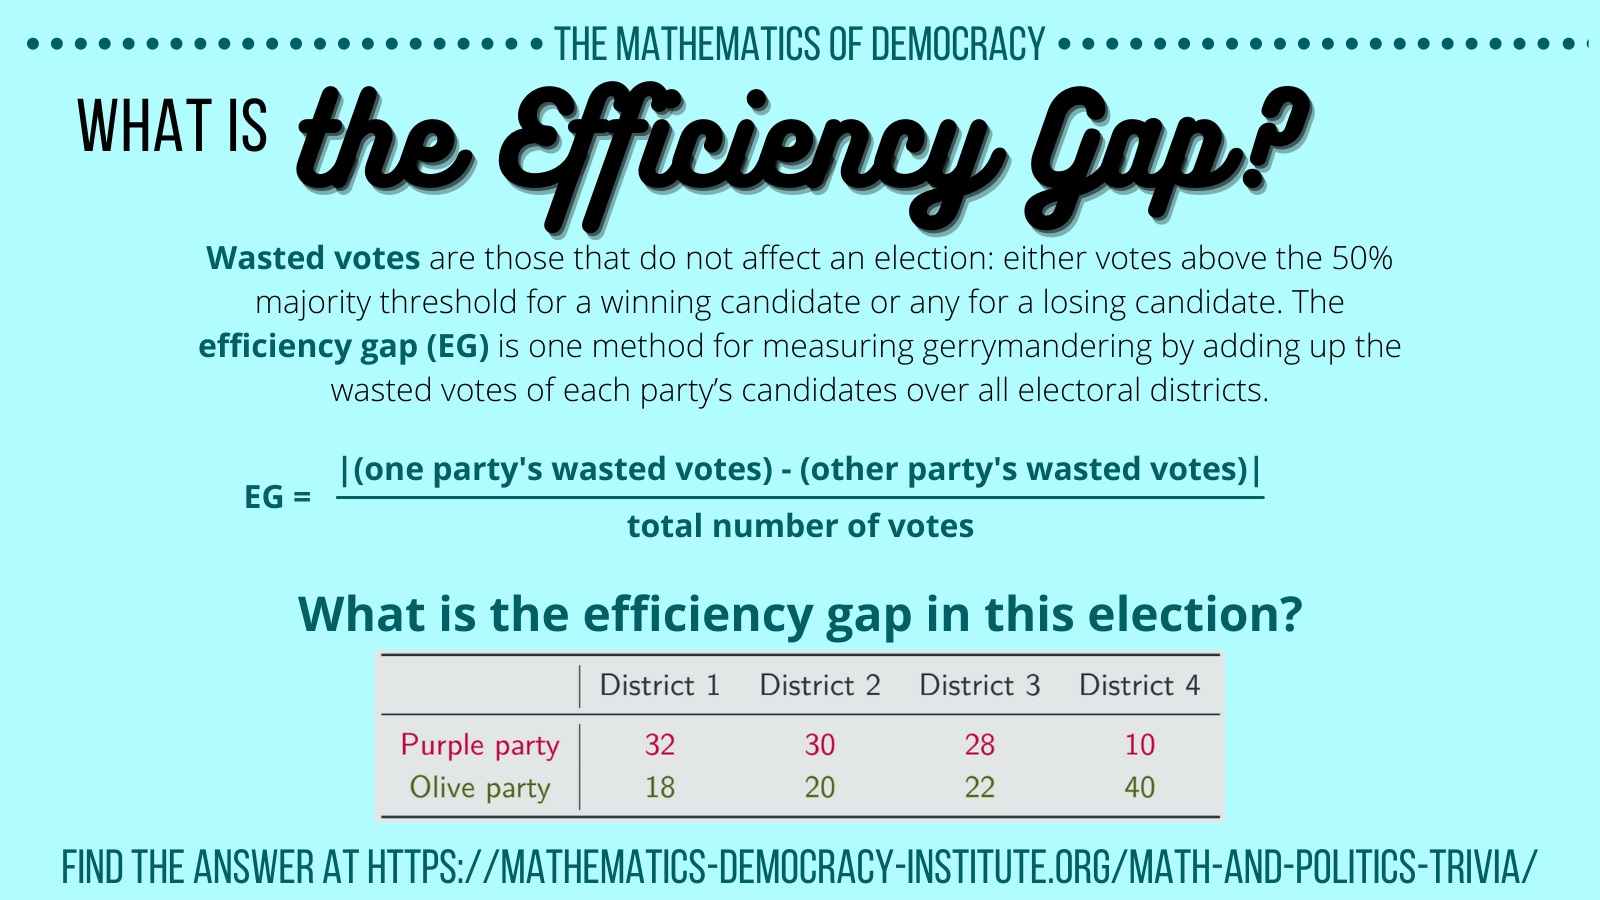
Using the infographic’s 50% threshold, winning votes above 25 are wasted. Losing votes are all wasted.
| District | Purple votes | Olive votes | Purple wasted | Olive wasted |
|---|---|---|---|---|
| 1 | 32 | 18 | 7 | 18 |
| 2 | 30 | 20 | 5 | 20 |
| 3 | 28 | 22 | 3 | 22 |
| 4 | 10 | 40 | 10 | 15 |
| Total | 100 | 100 | 25 | 75 |
Purple’s first-district tally illustrates the winning-vote rule: 32 votes minus the chosen threshold of 25 leaves 7 wasted votes. Olive loses that district, so all 18 of its votes are counted as wasted. Across the election, the parties have equal vote totals, but Purple wins three of four seats and wastes far fewer votes. With 200 votes cast, the gap is
favoring Purple.
Now use the stricter rule that a winner needed 26 votes. Purple’s wasted votes become . Olive’s become . The gap is then
still favoring Purple. The conclusion about which party benefits has not changed. The one-percentage-point difference arises because, in an election this small, changing the winning threshold by one vote per district is noticeable.
The mechanism should also look familiar from packing and cracking. Olive’s 40–10 win uses many votes beyond its winning threshold, while its voters in the other three districts lose. Purple turns narrower wins into three seats. The efficiency gap summarizes that contrast; it does not, by itself, establish how the boundaries were chosen.
Checking the method and its conventions
A second worked example uses the actual minimum winning total, rather than the 50% shortcut. It also introduces a faster seat-and-vote-share formula whose limitation will matter in the next section.
Read the Brennan Center’s district-by-district calculation, then its simplified calculation. Focus on how its choice of winning threshold affects the reported result and on its warning about turnout.
In “Calculating the Efficiency Gap” (printed pp. 2–3), read the worked calculation, stopping before the discussion of proposed legal thresholds. Then, in “Simplified Efficiency Gap Calculation” (printed p. 4), read the shortcut and caution through the final sentence about equal turnout.
In that example, each district casts 100 votes, so winning outright takes 51. A candidate who receives 75 wastes winning votes. Applying the same rule throughout produces 173 wasted Democratic votes and 72 wasted Republican votes, out of 500 total votes. The district-by-district result is therefore
favoring Republicans. The resource reports this as approximately 20%.
For equal-turnout districts, there is a useful shortcut under the exactly-50% threshold convention. Let be A’s share of votes statewide and its share of seats. Define a signed gap as B’s wasted votes minus A’s, divided by all votes. Then
A positive favors A; a negative one favors B. In the Brennan Center example, Democrats have 55% of votes and 40% of seats. The shortcut gives a gap of , or 20% favoring Republicans. The direct count gives 20.2% because it uses 51, rather than exactly 50, as the winning threshold. For a small election, keep the threshold convention visible; do not expect the shortcut and an integer-majority count to match perfectly.
Why turnout changes the interpretation
Equal population in districts does not guarantee equal turnout. Suppose four districts each contain 100 eligible voters, but turnout differs. Use the 50% threshold convention for this example.
| Districts | A votes per district | B votes per district | Votes cast per district | Winner |
|---|---|---|---|---|
| Two high-turnout districts | 65 | 35 | 100 | A |
| Two low-turnout districts | 10 | 40 | 50 | B |
A and B each receive 150 votes statewide, and each wins two seats. If you looked only at vote shares and seat shares, you would see 50% for each party on both measures.
The wasted-vote totals tell a different story. In each high-turnout district, A wastes 15 votes beyond 50, while B wastes all 35 losing votes. In each low-turnout district, A wastes its 10 losing votes, while B wastes 15 votes beyond 25. Thus
Out of 300 votes cast, the gap is , or about 16.7% favoring A. Yet putting A’s 50% seat share and 50% vote share into the equal-turnout shortcut would give zero. The shortcut fails here because a seat won in a 100-vote district enters the wasted-vote count differently from a seat won in a 50-vote district.
This is a reason to inspect district-level turnout before treating a gap as a simple account of seats versus votes. Turnout differences may affect the score even when districts have equal populations. The score alone does not explain why turnout differed or whether anyone manipulated boundaries.
The fairness benchmark inside the number
The efficiency gap asks whether the parties have equal wasted-vote totals. That is a particular fairness goal, not another name for proportional representation or for competitive elections.
Under equal turnout and the 50% shortcut, a zero gap requires
At a 50–50 vote split, this calls for a 50–50 seat split. At 60% of votes, however, it calls for 70% of seats, not the 60% of seats sought by a proportionality benchmark. Conversely, an outcome with 60% of votes and 60% of seats is proportional but has a gap of about 10% favoring the other party under that shortcut. As in the worked examples, counting the exact integer majority can shift these small-election figures slightly.
Nor does a small gap imply close races. Two parties could have equal wasted-vote totals while each wins several districts comfortably. And a large gap does not, on its own, distinguish deliberate packing and cracking from patterns arising without partisan manipulation. The measure identifies an electoral pattern to investigate, not the cause of that pattern.
Conclusion
To calculate an efficiency gap, count each party’s losing votes and its winning votes above a stated threshold, add them across districts, and divide the difference by all votes cast. Report both the percentage and which party wasted fewer votes. Use the seat-and-vote-share shortcut only with its equal-turnout and threshold assumptions in view.
Most importantly, interpret the result as a measure of unequal wasted votes. That benchmark can disagree with proportionality, and turnout can change the result even when statewide vote and seat shares look balanced. The next lesson returns to partisan symmetry, using a seats-votes curve to assess how a map would treat either party at different levels of support.