Hello! Welcome to the fifth and final lesson of our first module on the foundations of AI workloads.
In our last lesson, we established the theoretical basis for batch size, exploring the critical trade-off between throughput and resource utilization. We discussed how larger batches can keep the GPU busy, increasing throughput, while the primary constraint is the finite amount of GPU memory, leading to "Out of Memory" (OOM) errors if the batch size is too large.
Today, we transition from theory to practice. You will use a pre-existing benchmarking script to directly observe these effects. This hands-on exercise is designed to solidify your understanding by having you manipulate the batch size and measure the impact on two key performance indicators: training time and GPU memory consumption. This is a fundamental skill for any performance engineer working with AI systems.
Part 1: Why Batch Size Dominates GPU Memory Usage
Before we run our experiment, let's crystallize our understanding of why batch size has such a dramatic effect on memory. As we discussed, a training step requires storing not just the model's weights, but also:
- Input Data: The batch of images itself.
- Activations: The intermediate outputs of each layer during the forward pass. These are needed for the backward pass.
- Gradients: The results of the backward pass, which have a similar size to the model's parameters.
- Optimizer State: Optimizers like Adam store additional information (e.g., momentum), further increasing the memory footprint.
The size of the input data and, most significantly, the activations, scales directly with the number of samples in the batch. Processing 64 images requires storing 64 times more activation data than processing a single image.
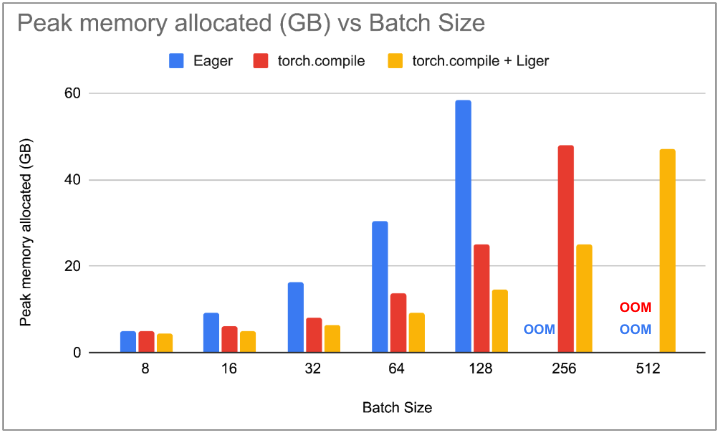
This relationship is often linear, as shown in the chart below. As the batch size increases, the peak memory allocated on the GPU rises steadily until it hits the hardware limit, causing an OOM error.
To build a stronger mental model of this, let's look at how memory consumption can be estimated.
Tips Tricks 16 - How much memory to train a DL model on large images
The video 'How much memory to train a DL model on large images' by DigitalSreeni provides an excellent breakdown of where memory goes during training.
Watch from 01:32 to 09:35. The first part (01:32 - 07:11) walks through a manual calculation showing how memory for feature maps (activations) explodes with larger images and batch sizes. The second part (07:11 - 09:35) discusses the other memory consumers, like model parameters and gradients. This will give you a concrete feel for the numbers involved.
Part 2: The Hands-On Experiment
Now it's time to see this in action. We will use a fantastic, self-contained Python script designed to benchmark image classification models. This is perfect for our goal, as it allows us to easily specify a model and a list of batch sizes to test, and it will automatically measure and report the performance metrics we care about.
Setup
-
Environment: This script requires a Python environment with a GPU and CUDA installed. Google Colab provides a free, ready-to-use environment. Alternatively, you can use a local machine if you have an NVIDIA GPU and the CUDA toolkit configured.
-
Code: The benchmarking script is available in the article "Benchmarking Image Classification Models Performance" and its associated GitHub repository.
Benchmarking Image Classification Models Performance
First, let's get acquainted with the script we'll be using. This article by Ruman from 'rumn' provides the script and a great explanation of its functionality.
Please start by reading the sections 'The Benchmarking Script', 'Key Components', and look over the full code block. You don't need to understand every line, but get a feel for its structure. Note the command-line arguments it accepts, which we will use to control the experiment.
-
Dependencies: Install the necessary libraries using pip:
pip install torch torchvision timm numpy pandas matplotlib psutil -
Data: The script requires a directory of images. You can download a small dataset like the Kaggle Cats and Dogs dataset (just use a few hundred images from the training set) or simply use a folder of your own JPEG images.
The Task: Running the Benchmark
Now, you will execute the script. We will test a single, common model (resnet50) with a range of batch sizes to observe the impact on performance and memory.
-
Download the script (
bench.py) from the GitHub repository linked in the article. -
Open your terminal or a Colab notebook cell.
-
Run the following command, replacing
/path/to/your/imageswith the actual path to your image directory. We will test batch sizes 1, 4, 8, 16, 32, and 64.python bench.py --image_dir /path/to/your/images --run_on_gpu --batch_sizes 1 4 8 16 32 64Note: The script is configured to benchmark multiple models. For this exercise, feel free to edit the
MODELSlist in the script to only include["resnet50", (224, 224)]to speed up the process. -
Observe the output. The script will print its progress. Pay attention to the memory usage and timing as it cycles through the different batch sizes. If your GPU has limited memory (e.g., <12GB), the script might fail with an Out of Memory error on the larger batch sizes. This is an expected and important result to observe!
Analyzing the Results
After the script finishes, it will save a .csv file with the detailed results. Open this file. Your task is to analyze the relationship between the columns.
To guide your analysis, review the meaning of the output metrics.
Benchmarking Image Classification Models Performance
The same article provides a clear explanation of what each column in the output CSV file means.
Read the section 'Benchmark result' to understand the key metrics we are interested in: batch_size, latency_ms, single_image_latency_ms, and gpu_memory_used_gb.
Now, examine your results and answer these questions:
- How does
gpu_memory_used_gbchange asbatch_sizeincreases? Does it match your expectation? - How does
latency_ms(the time to process a whole batch) change asbatch_sizeincreases? - How does
single_image_latency_ms(the average time per image) change asbatch_sizeincreases? What does this tell you about throughput?
You should observe that while the time per batch (latency_ms) goes up, the time per image (single_image_latency_ms) goes down, indicating that you are processing more images per second. This is the efficiency gain we discussed.
Test your understanding!
You observe that going from a batch size of 16 to 32 increases the latency_ms (time per batch) from 50ms to 80ms. Is this a good or bad result from a throughput perspective?
Show answer
This is a good result. Even though the time per batch increased, you processed twice the data (32 images vs. 16) in less than twice the time (80ms vs. 2 * 50ms = 100ms).
- At batch size 16, throughput is 16 images / 50ms = 320 images/sec.
- At batch size 32, throughput is 32 images / 80ms = 400 images/sec.
Your overall throughput has increased.
Conclusion
Congratulations on completing your first hands-on AI performance experiment! You have moved from theory to tangible measurement, a crucial step in performance engineering.
Key Takeaways:
- You ran a script to systematically vary the batch size and measure its impact.
- You observed that increasing batch size leads to a direct, and often linear, increase in GPU memory usage, eventually causing OOM errors if pushed too far.
- You measured that larger batches increase the time per step (
latency_ms), but decrease the time per sample (single_image_latency_ms), which means higher overall throughput. - This exercise demonstrates the core trade-off: you want the largest batch size that fits in memory to maximize throughput, without compromising the model's ability to learn.
In this module, we've treated the GPU as a bit of a black box. We fed it work and measured the outcome. But to truly diagnose performance issues—to understand why a particular workload is slow—we need to look inside.
In the next module, GPU Architecture and Core Metrics, we will do just that. We'll start by dissecting the key components of a modern GPU, such as Streaming Multiprocessors (SMs) and Tensor Cores, to understand how they contribute to AI performance.