In our last lesson, we traced the journey of oxygen and carbon dioxide across the thin alveolar-capillary barrier, driven by the physics of partial pressure gradients. We established that at the end of this process, oxygen successfully enters the blood. This lesson addresses the crucial next question: what happens then? How is oxygen efficiently transported from the lungs to every cell in your body?
Simply dissolving oxygen in blood plasma is insufficient to meet our metabolic demands. This delivery challenge is solved by an elegant carrier molecule: hemoglobin. We will explore its remarkable properties, which are visually and quantitatively summarized in the oxyhemoglobin dissociation curve. Understanding this curve is fundamental, as it explains how your body dynamically adjusts oxygen delivery in response to changing physiological states—a mechanism that is directly influenced by many of the breathwork techniques you aim to master.
Oxygen Transport: A Tale of Two Forms
When oxygen crosses into the pulmonary capillaries, it is transported in the blood in two ways. A tiny fraction dissolves directly into the plasma, while the vast majority binds to hemoglobin molecules within red blood cells.
Let's start by appreciating just how vital hemoglobin is for this process.
Oxygen Hemoglobin Dissociation Curve | Oxygen transport | Gas Exchange | Respiratory Physiology
This short clip from Byte Size Med clearly distinguishes between the two forms of oxygen transport and introduces the hemoglobin molecule.
Watch from the beginning to the limits of dissolved O₂ to see the quantitative difference between dissolved and hemoglobin-bound oxygen. Then, continue from hemoglobin's structure to familiarize yourself with its four-subunit structure and the concept of saturation.
As the video highlighted, over 98% of the oxygen in your blood is carried by hemoglobin (Hb). Each hemoglobin molecule can bind up to four oxygen molecules, one per heme group. The degree to which hemoglobin is filled with oxygen is called percent saturation. When blood leaves the lungs, it is normally about 97-98% saturated.
The Oxyhemoglobin Dissociation Curve: A Visual Model of Affinity
The relationship between the partial pressure of oxygen (PO₂) in the blood and the percentage of hemoglobin that is saturated with oxygen is not linear. Instead, it is described by a characteristic S-shaped (sigmoidal) curve. This is the oxyhemoglobin dissociation curve.
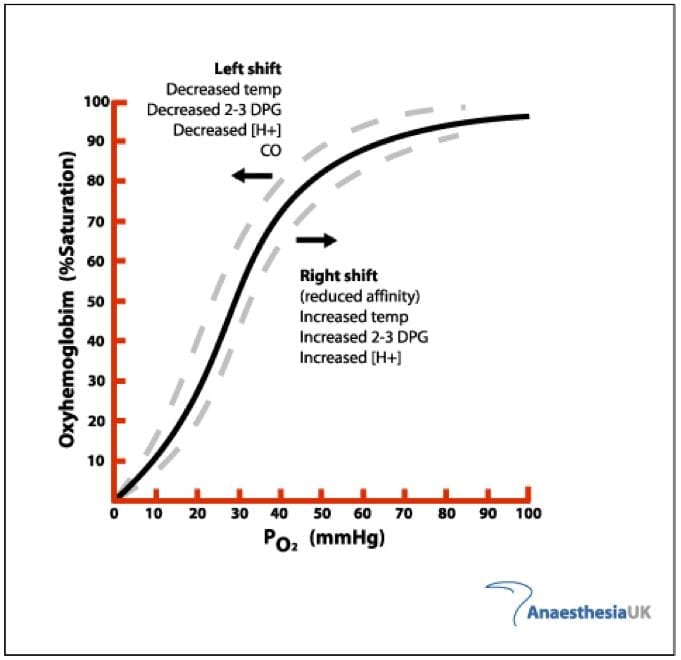
The shape of this curve is a direct result of a property called positive cooperativity. The binding of the first oxygen molecule to a heme group causes a conformational change in the hemoglobin molecule, making it progressively easier for the subsequent three oxygen molecules to bind.
The oxyhaemoglobin dissociation curve
This article from Deranged Physiology provides a more detailed look at the molecular mechanics behind the curve's shape.
First, read the summary section to reinforce the key features of the curve, particularly the text from the initial definition. Then, jump down to the section "The concept of positive cooperativity" and read from the full explanation. This part explains the shift from the "Tense" (T) state to the "Relaxed" (R) state, which is the structural basis for cooperativity.
The sigmoidal shape is not an accident of biochemistry; it is a masterpiece of functional design, perfectly suited for oxygen transport:
-
The Plateau (Loading in the Lungs): Look at the flat upper portion of the curve. In the lungs, where the PO₂ is high (~100 mmHg), hemoglobin is nearly 100% saturated. The flatness provides a safety margin: even if your alveolar PO₂ drops to 80 or even 70 mmHg (as might happen at altitude), hemoglobin saturation remains high (above 90%), ensuring consistent oxygen loading.
-
The Steep Slope (Unloading at the Tissues): Now look at the steep part of the curve. At resting tissues, the PO₂ is around 40 mmHg. Following the curve, we see this corresponds to a hemoglobin saturation of about 75%. This means about 23-25% of the oxygen has been "dissociated" from hemoglobin and delivered to the tissues. During vigorous exercise, the PO₂ in muscle tissue can drop to 20 mmHg. On this steep part of the curve, a small drop in PO₂ from 40 to 20 mmHg results in a large drop in saturation (from 75% down to ~30%), releasing a massive amount of additional oxygen to meet the increased metabolic demand.
The following video provides an excellent quantitative walk-through of this process. Given your background in statistics, the numerical precision here will be particularly illuminating.
Respiratory | Oxygen-Hemoglobin Dissociation Curve
The presenter, Ninja Nerd, meticulously calculates the amount of oxygen unloaded at rest and during exercise, providing a concrete understanding of the curve's utility.
First, watch the segment explaining oxygen delivery under normal resting conditions. Pay close attention to how he uses the saturation values at PO₂=104 mmHg and PO₂=40 mmHg to calculate that ~23% of oxygen is unloaded. Next, watch the segment on oxygen delivery during vigorous exercise. Follow his calculation as the tissue PO₂ drops to 20 mmHg, resulting in ~68% of oxygen being unloaded. This demonstrates the power of the steep portion of the curve.
Factors That Shift the Curve: Modulating Oxygen Delivery
The body can fine-tune oxygen delivery by changing hemoglobin's affinity for oxygen, which graphically translates to shifting the entire curve to the right or to the left.
- A Shift to the Right means a decrease in hemoglobin's affinity for O₂. At any given PO₂, hemoglobin holds on to oxygen less tightly, resulting in a lower saturation. This facilitates the release of oxygen to the tissues. The mnemonic is "Right Releases."
- A Shift to the Left means an increase in hemoglobin's affinity for O₂. Hemoglobin binds oxygen more tightly, making it harder to release. The mnemonic is "Left Loves."
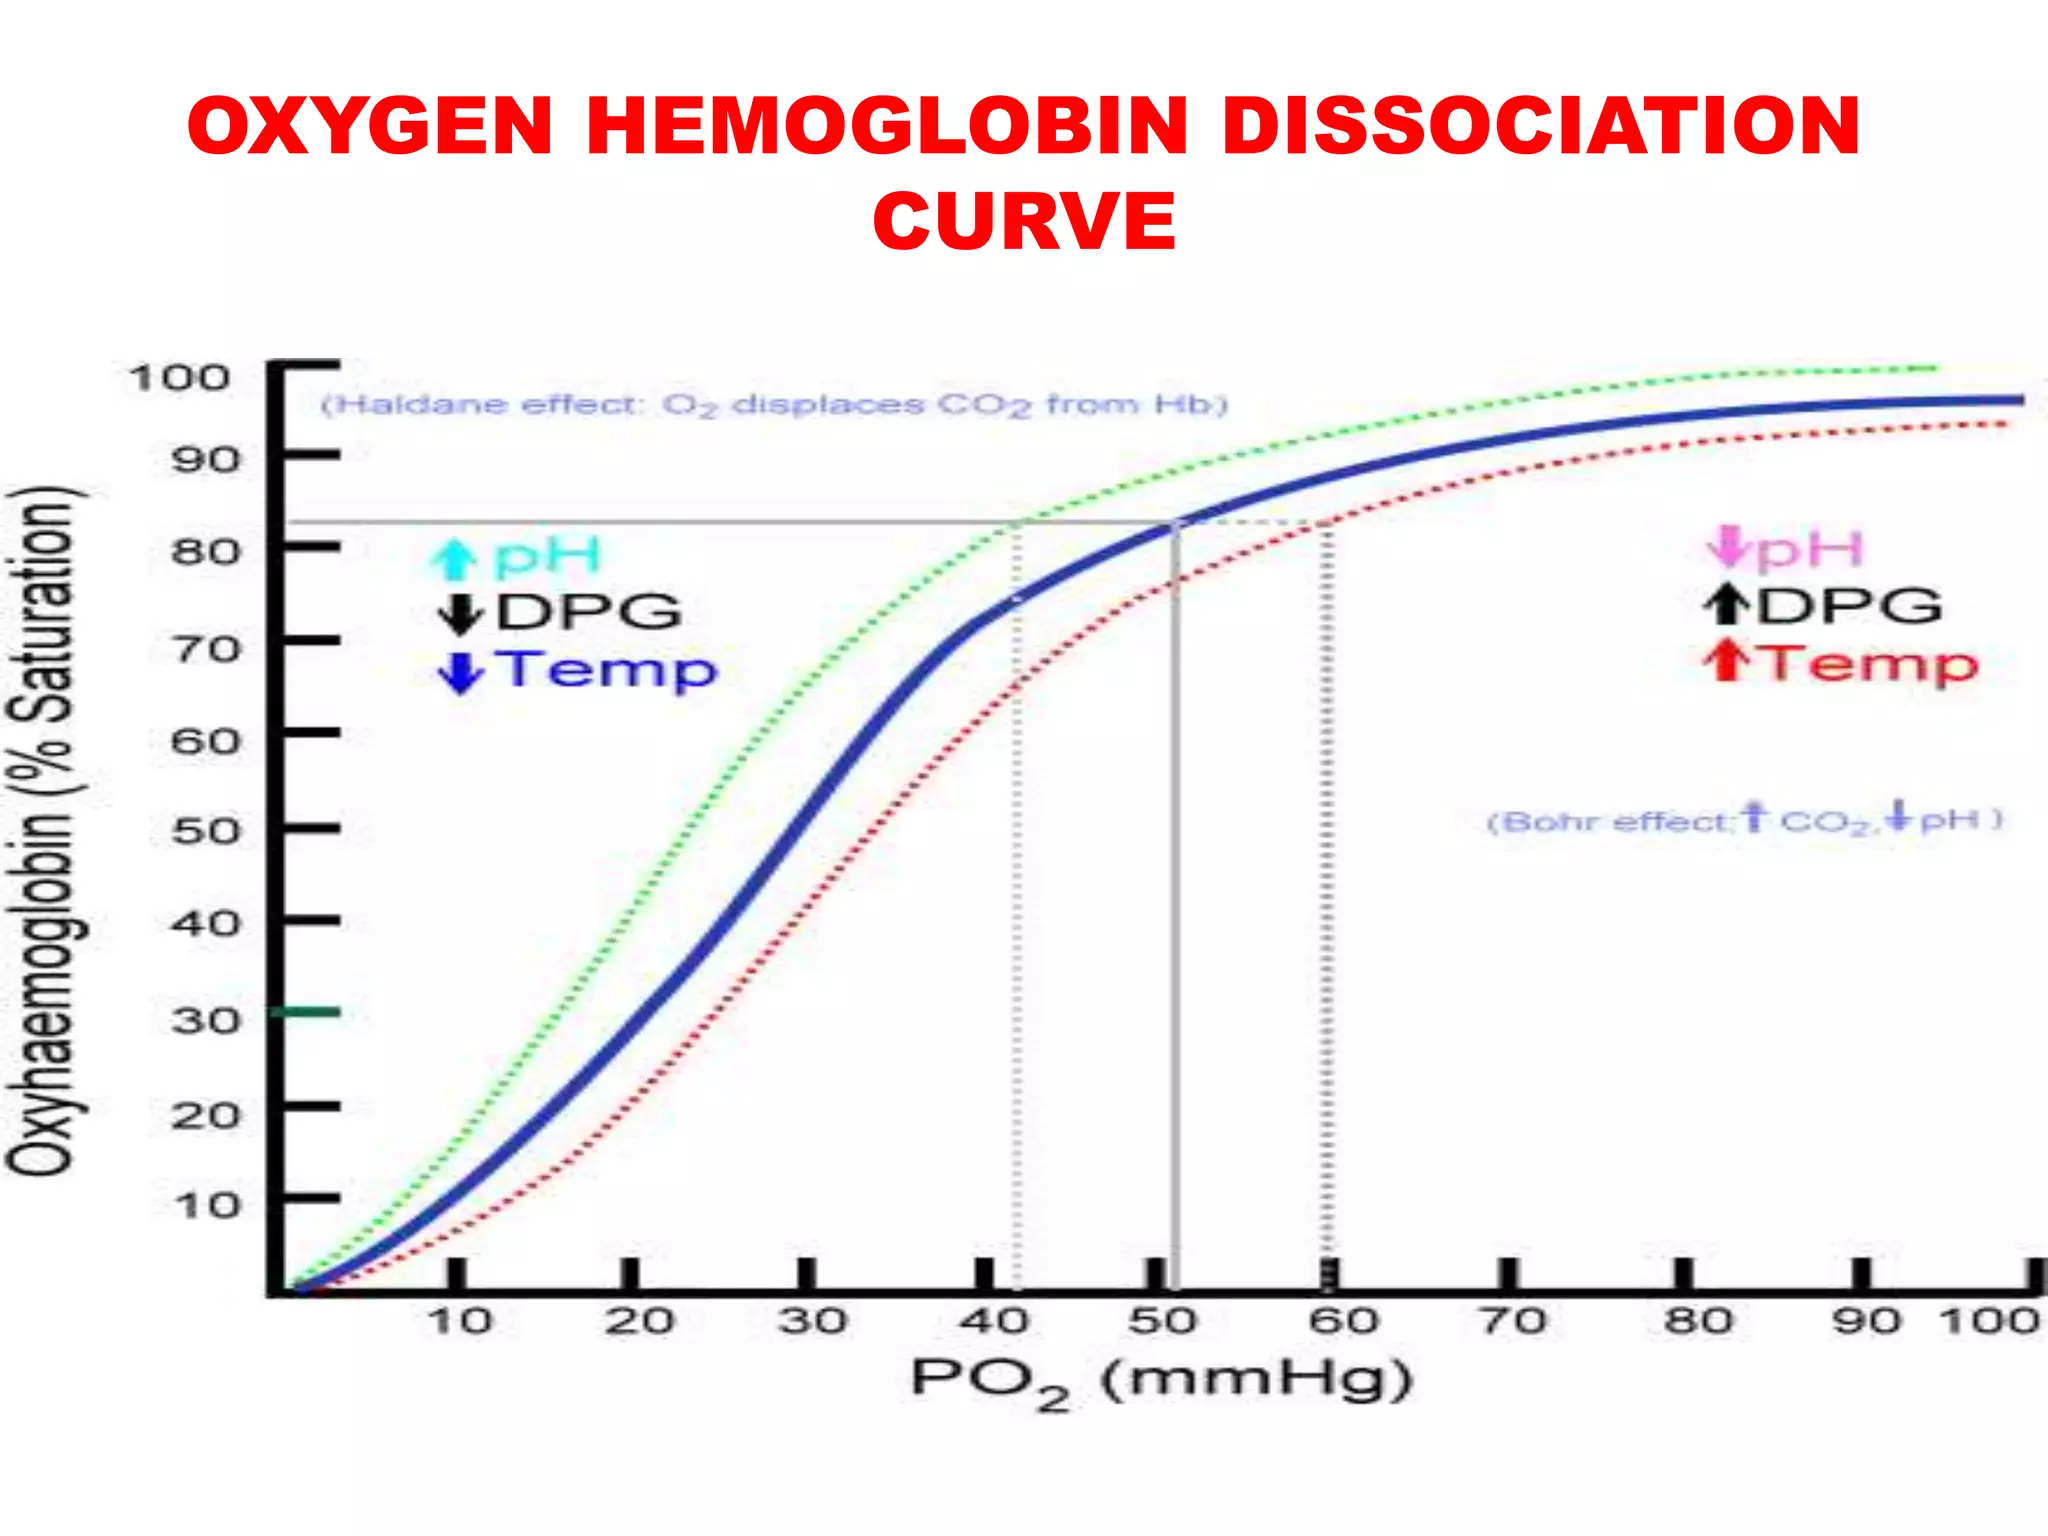
A key metric used to quantify this shift is the P50, which is the partial pressure of oxygen at which hemoglobin is 50% saturated.
- A normal P50 is about 27 mmHg.
- An increase in P50 (e.g., to 30 mmHg) indicates a rightward shift.
- A decrease in P50 (e.g., to 24 mmHg) indicates a leftward shift.
The primary factors that cause a rightward shift and enhance oxygen delivery are precisely the conditions found in metabolically active tissues:
- Increased Temperature: Active muscles generate heat.
- Increased CO₂: Active muscles produce CO₂.
- Increased H⁺ (Lower pH): CO₂ reacts with water to form carbonic acid, which releases H⁺ ions, lowering the pH.
- Increased 2,3-Diphosphoglycerate (2,3-DPG): A substance produced by red blood cells during glycolysis; its levels increase in conditions of chronic hypoxia.
This is an incredibly elegant feedback system. The very tissues that need the most oxygen produce the signals that tell hemoglobin to release it more readily. We will explore the specific effects of CO₂ and pH, known as the Bohr effect, in detail in our next lesson.
From Theory to Primary Data
As requested, let's move from textbook diagrams to real experimental data. Your interest in clinical trial literature makes this a valuable step. The following resource is a research paper that directly investigated the effects of temperature and PCO₂ on the P50 value.
Effects of Carbon Dioxide and Temperature on the Oxygen ...
This article from Frontiers in Medicine provides an excellent example of how these physiological principles are studied experimentally.
First, read the introduction to understand the study's context and the definition of the key factors like P50 and the Bohr effect. Next, examine the results. Go to the section "Factors Affecting P50". Look at Figure 3. This boxplot graphically shows the core finding: as PCO₂ increases (from 20 to 80 mmHg) at a given temperature, the P50 increases, signifying a rightward shift. Then, look at Figure 4. This nomogram models the combined effect of changes in temperature and PCO₂ on P50. Trace the line for 37°C (yellow). You can see that increasing PCO₂ from a baseline of 40 mmHg to 80 mmHg (a ΔPCO₂ of +40) increases the P50 by about 5-6 mmHg. This is a quantitative representation of the rightward shift. Finally, read the first paragraph of the Discussion section. The authors summarize their findings, noting the significant interaction between the effects of CO₂ and temperature on the curve.
This paper provides a direct look at the raw science. The researchers systematically manipulated the variables (PCO₂, temperature) and measured the outcome (P50), confirming the principles we've discussed and adding nuance about their interaction.
Conclusion
In this lesson, we have seen how oxygen, after entering the bloodstream, is efficiently transported by hemoglobin. The oxyhemoglobin dissociation curve is not merely a graph; it is a model that describes the dynamic, cooperative binding of oxygen and explains how oxygen delivery is exquisitely matched to metabolic demand.
Key takeaways from this lesson are:
- Over 98% of blood oxygen is transported bound to hemoglobin.
- The oxyhemoglobin dissociation curve is a sigmoidal graph of PO₂ vs. %Hb saturation, reflecting hemoglobin's changing affinity for oxygen.
- The curve's S-shape is due to positive cooperativity, where binding one O₂ molecule increases affinity for the next.
- The flat top of the curve ensures reliable oxygen loading in the lungs, while the steep portion facilitates efficient oxygen unloading at the tissues.
- The curve shifts in response to physiological signals: a right shift (caused by high temp, CO₂, H⁺) decreases affinity and enhances O₂ release, while a left shift does the opposite.
- P50 is a quantitative measure of this shift and hemoglobin's oxygen affinity.
We've noted that increased CO₂ and decreased pH are major factors causing a rightward shift. This phenomenon is so important it has its own name: the Bohr effect. In our next lesson, we will dissect the Bohr effect in detail, examining the biochemical mechanisms and its direct relevance to breathwork techniques that intentionally manipulate CO₂ levels.